Genetic map of Russians. Genetics of Russian Ukrainians, Belarusians and Tatars, Slavs and Caucasians, Jews, Finns and other populations Genetic map of peoples created by Russian scientists

German scientists have created an interactive map of the genetic mixing of peoples throughout history. Their article on the methodology for its creation was published in the scientific journal Science.
To create it, scientists had to take DNA samples from 1,490 people living in 90 various places all over the world.
After sequencing the DNA and identifying similarities and differences, the researchers were able to create a kind of global atlas.
It allows you to interactively see the likely genetic consequences historical events, including European colonialism, the emergence of the Mongol Empire, the Arab conquests, and trade along the Silk Road.
Interesting data was obtained from a study of 20 residents of Georgia: most of the genes they came from were from the Circassians, then from the Greeks, then from the Armenians and southern Italians.
The Circassians have the most genes that came from Georgians, Hungarians and Turks.

Lezgins have the most genes that came from Austrian Germans, Armenians and Georgians

Armenians have genes from Iranians, Georgians and Poles, but the origin of the Armenians themselves is not clear, as stated on the website of this map
This study uses more than 80,000 autosomal SNPs, reference points - this is a very high resolution that allows us to capture even relatively small influences at the genetic level in the bulk of the population. The comparative analysis data was taken from an open study by V. Verenich, a specialist in comparative analysis of genetic components. The genetic calculators themselves are located on the GedMatch service, and allow anyone to find out their comparative position on the genetic graph. To do this, it is enough to have the results of an autosomal test from FTDNA or 23andMe. At the end of the study, maps of geographic distribution and frequency maxima for the main autosomal components are provided from the MDLP World-22 project.
The graphs below show the main components and their average percentages for each population. One line shows the percentage breakdown for one population. Each division (vertical bar) represents 10%, and the names of the autosomal components are arranged in the same sequence from left to right as in the legend from top to bottom. The more similar the percentage composition general genetics at different nations, the more similar the figure looks in the above graph. So let's get started...
Genetics of Germans, Lithuanians, Russians, Swedes, Finns, etc.
This graph shows the main genetic components for European peoples and are aligned by decreasing the East European component (North-East-European) in different populations. As you can see, all European peoples are quite different genetically, and having genetic components of the same origin in their set, they nevertheless have very different percentages. For all Slavs and Balts in general, this component is one of the most significant Eastern Europe, which is at its maximum among Lithuanians and Belarusians. Probably since the time of the archaeological “Corded Ware Culture,” the territory of these countries has been the center of origin of this component. It is represented by more than 80% among Lithuanians, and only 20% among Italians.The purple color represents the Atlanto-Mediterranean component, and it increases as you move from northeast to southwest. So among Finns it reaches an average of 15%, and among Italians 40%. The remaining components are less pronounced.
Genetics of Russian Ukrainians and Belarusians

This graph shows the Eastern Slavs - Russians, Belarusians, Ukrainians. The similarity of the genetic patterns of the three listed peoples is noteworthy, and within the margin of error they differ very slightly - among Ukrainians and southern Russians there is a slight increase in the West Asian component, and among northern Russians there is a slight increase in one of the Siberian components, called conditionally Samoyed, and an increase components of the Mesolithic of Europe up to approximately 10%, which according to the latter indicator brings them closer to the German-speaking population of Scandinavia - the Swedes.

This graph depicts all Slavs, including the western ones - Poles and Czechs, as well as the southern ones - Serbs, Bulgarians, Macedonians, etc.
All Slavs have 2 main components. These are Eastern European and Atlantic-Mediterranean. The first is at its maximum among Belarusians, and the second among all southern Slavs - Serbs, Macedonians, Bulgarians. The Eastern European component is more primary in origin among the Slavs, and the Atlantic-Mediterranean is in to a greater extent acquired as the Slavs migrated to the Balkans. Western Ukrainians and Slovaks have a slight increase in the Samoyed component relative to the neighboring Slavic peoples - Belarusians, Czechs, Poles; This is probably a genetic trace of the medieval migrations of the Huns and Ugrians to Central Europe.
Genetics of Slavs, Russians and Tatars, Germans, Caucasians, Jews, etc.
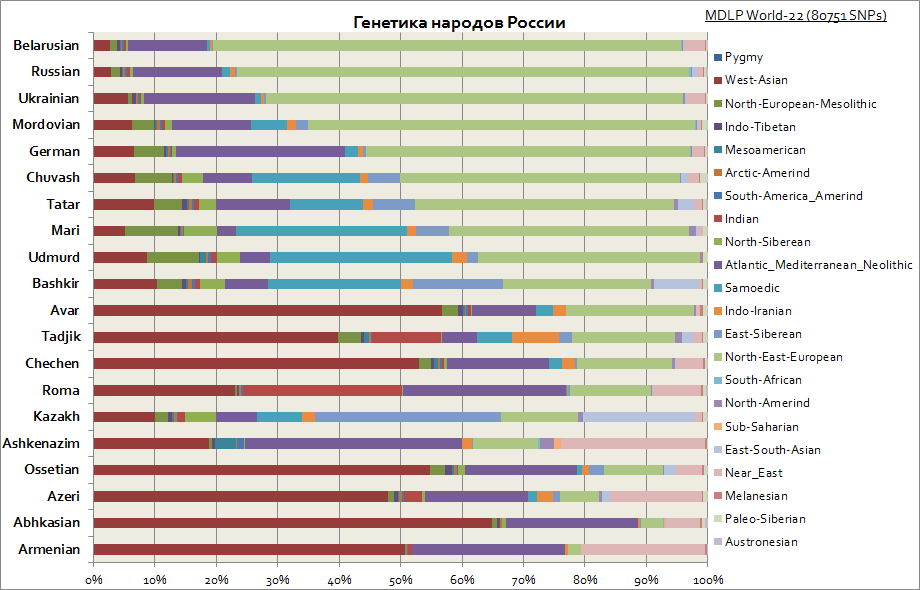
This graph shows the different origins among the peoples of Russia. As you can see, among the Slavs the main one is the Eastern European component, and among the peoples of the Volga region the proportion of Siberian components increases. While for Caucasians the West Asian, Mediterranean and Middle Eastern components are most characteristic.
Genetics of Finns, Ugrians, Udmurts, Hungarians, Sami, etc.

As you can see, the Finns, Vepsians and Karelians are characterized by similar genetic origin with the Slavs. They also have the highest Eastern European component, decreasing closer to the Urals and the Volga region, with an increase in Siberian components in this region. Also, all Finno-Ugric peoples have a significantly pronounced Mesolithic component of Europe, which reaches almost 80% among the Sami and is associated with the pre-Indo-European and pre-Neolithic population of Europe. Hungarians in general are characterized by a set of the same genetic components as other populations of the Carpathian region and Central Europe.
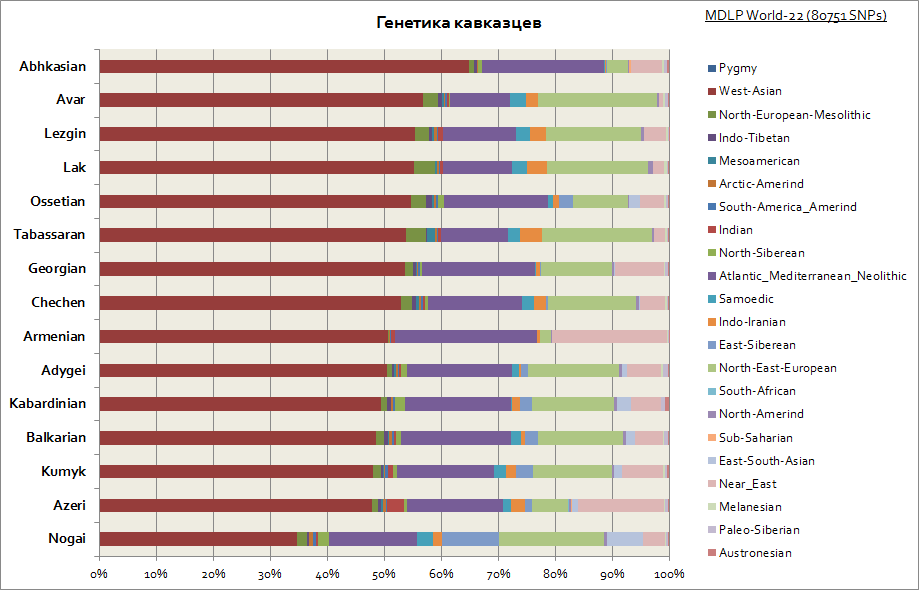
As you can see, the entire Caucasus is characterized by a relatively similar genetic origin - a large share of the West Asian and Mediterranean components. Only the Nogais stand out a little - their share of Siberian components is increasing.

As can be seen among Ashkenazim and Sephardim there is a high frequency of West Asian, Atlanto-Mediterranean and Middle Eastern components. At the same time, the Ashkenazim have a slight increase in the Siberian component, which is probably due to the Khazar heritage, and an increase of up to 30% in the East European component, which in this indicator brings them closer to the countries of southern Europe.
The only people who especially stand out from their “company” are Ethiopian Jews and Indian Jews. The former have a high proportion of sub-Saharan Africa (up to 40%), and the latter have a proportion of the South Asian genetic component, conventionally called Indian (up to 50%).
Genetics of Tatars, Bashkirs, Azerbaijanis, Chuvashs, etc.
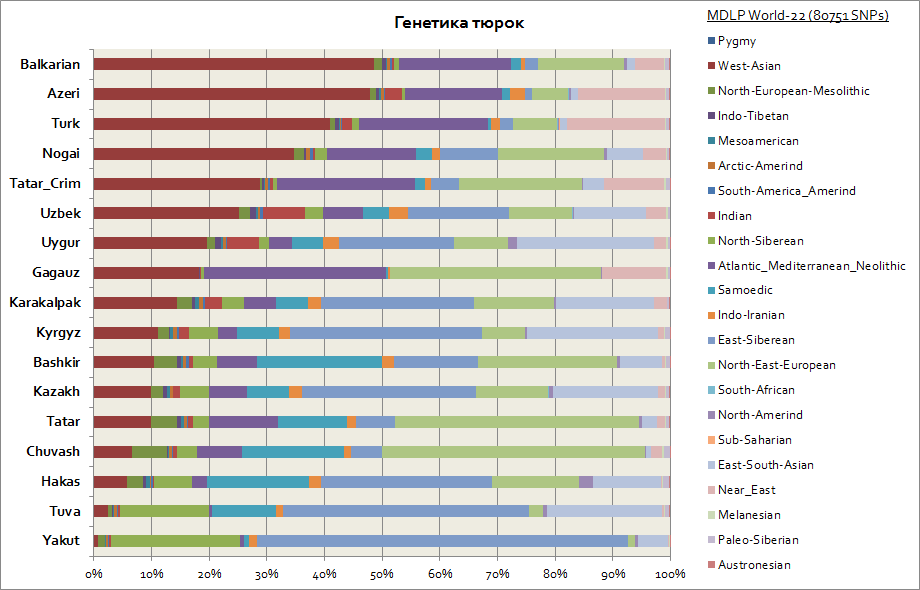
In genetic terms, the Turks turned out to be one of the most heterogeneous ethnic groups, because their genetic components differ significantly. So, taking into account that the primary homeland of the Turks is Siberia, such peoples as the Yakuts, Tuvinians, Khakassians have retained the East Siberian autosomal component in the largest percentage, which reaches from 30 to 65%. This genetic component is also the main one among the Kyrgyz and Kazakhs. The remaining components bring the Turks closer to the peoples from the regions of their residence. So, for the Yakuts and Tuvans, these are the North Siberian and Samoyed components. In total these are 3 Siberian components among the Yakuts it is up to 90%, among the Tuvinians up to 70%, with an increase to 20% of the East-South Asian component, which is associated to a greater extent with the migration flows of the population of East Asia. For the Bashkirs, the share of 3 Siberian components is up to 45%, and Southeast Asian up to 10%. The Tatars have 3 Siberian genetic components on average from 25 to 50%. Moreover, the share of components characteristic of the Caucasian population among the Bashkirs is up to 45%, and among the Tatars on average from 50 to 70%. The genetics of Azerbaijanis and Turks, within the margin of error, practically do not differ; they, like other peoples of the Caucasus and Transcaucasia region, have a significant presence of the West Asian component (reaches 50%) and the Atlantic-Mediterranean component (on average up to 20%). The share of 3 Siberian components is represented by Azerbaijanis, Turks and Balkars - at the level of 3-7%.
Conclusion
The genetics of peoples do not have a direct and significant correlation with the distribution of language families, or with the percentage of uniparental markers - Y-DNA and mt-DNA haplogroups - represented in a particular population. The greatest correlation can be traced according to the territorial-geographical principle. Thus, the share of Siberian components characteristic of the Mongoloid race as a whole gradually decreases from East to West, and the share of components characteristic of the Caucasian race increases accordingly. In the border areas along the line from the north of the Urals to Central Asia, their ratio is approximately equal. In the regions east of Baikal, the genetic components characteristic of the large Caucasoid race are practically no longer represented, while at the same time, in the regions west of the Pechora-Volga region line, the Siberian components characteristic of the large Mongoloid race are disappearing.The spread of the Eastern European genetic component to Siberia occurred to a large extent already in Bronze Age(cultures of the Andronovo circle), although individual peaks in the extreme east of Siberia among the Chukchi may already be associated with Russian migrations in the 17th century.
The share of the Sub-Saharan component characteristic of the Negroid race is distributed throughout Africa - right up to the southern Mediterranean and the northern border of the African continent, reaching a maximum in its equatorial part, and practically never occurs beyond its borders; lightly distributed on the Arabian Peninsula and the southern part of the Iranian plateau.
Geography of genetic components
Alexey Zorrin
Project
Researchers created for the first time detailed map genetic structure of UK populations. It turned out that the population of the Celtic territory was not at all genetically homogeneous, and the most ancient gene pool was preserved in Wales. Comparisons of British and Continental European DNA indicated a genetic ancestral profile for each region. In the gene pool of the modern population we were able to see a reflection major events in the history of the settlement of the British Isles.
Studying the genetic differences between modern populations helps us look deeper into history and see the traces of migrations of population groups that formed the modern gene pool. This work was carried out by an international group of researchers led by British specialists from the University of Oxford and University College London, their article was published in the journal Nature on March 19. Walter Bodmer, Peter Donnelly and their colleagues analyzed in detail the genetic structure of the UK population. They not only built a very accurate genetic map of the modern British population, but also found traces of the most important historical migrations and clarified the pattern of settlement of the British Isles.
The gene pool reflects geography
The researchers collected DNA from 2,039 people from different areas of the UK. When choosing, they were guided by the following rule: all third-generation ancestors of a person (both grandmothers and both grandfathers) had to live no further than 80 km from each other. This condition provided a “snapshot” of the genetic structure of the British population of the late 19th and early 20th centuries.
To compare DNA, scientists used more than 500 thousand single nucleotide polymorphisms (SNPs) scattered throughout the genome. Their analysis was carried out using the fineSTRUCTURE and GLOBETROTTER statistical methods. These methods sorted DNA samples into clusters based on their similarity, regardless of where in the UK they were collected. And by placing each person's sample at a point midway from their grandparents' birthplaces, they were able to see how genetic similarity correlated with geographic location.
Genetic clusters into which 2039 DNA samples from UK populations were grouped.
The coincidence turned out to be amazing. As can be seen in the figure, 17 genetic clusters were distributed on the map in accordance with the geographical location of the samples taken. Different clusters practically do not overlap. And since these clusters were formed from all samples, without taking into account their geography, this means that this correspondence reflects the real genetic diversity of the population, the authors emphasize.
The population of the county of Orkney on the Orkney Islands north of Scotland turned out to be the most genetically diverse; it includes three clusters. Genetic differences emerge clearly between different areas of the UK: northern England, Scotland and Northern Ireland together differ from southern England, northern Wales differs from southern England, and Cornwall forms a separate cluster. The boundaries of the clusters often coincide with the modern boundaries of historical provinces, for example, on the border of Cornwall and Devon, on the border of England and Wales. The largest cluster (indicated by red squares on the map) covers much of central and southern England and the east coast. It combines almost half of the DNA samples included in the study.
The authors constructed a phylogenetic tree of British populations, showing how clusters were formed and how the main branches were separated. As the tree shows, the Orkney branch of the population split off at the earliest stage, followed by Wales at the next stage. Subsequent forks in the tree led to the separation of north and south Wales, the separation of northern England, Scotland and Northern Ireland from the rest of England, and the separation of Cornwall from the remaining clusters.
Thus, the idea of the genetic homogeneity of the Celtic populations of Great Britain as the most ancient, not influenced by the Saxon migration, was not confirmed. On the contrary, the Celtic part of Great Britain (Scotland, Northern Ireland, Wales and Cornwall) turned out to be much more genetically diverse than the rest of the territory.
Despite the fact that the clusters within the British population stood out so clearly, when scientists measured the genetic distance between them, it turned out to be small (average 0.002, maximum 0.007). This means that the observed differences are very subtle and can only be seen with extreme “magnification,” which is what the researchers created using a powerful statistical technique. For comparison, they analyzed their data using standard methods—principal component analysis (PCA) and ADMIXTURE. Both methods showed the separation of the Orkney and Welsh lineages, but did not reveal the finer genetic structure of the population.
Continental footprint in the British genome
Genetic differences within the British population may be a result of isolation separate groups population from each other, and in addition, reflect the contribution of various migrations and the process of mixing of migrants with the indigenous population. To sort out the latter, the researchers used the same method to compare DNA samples from the British population with samples from more than 6,000 continental Europeans from 10 countries. These samples were divided into 51 groups based on genetic similarity.

European genetic profiles for 17 UK clusters.
For each British cluster, scientists assessed the contribution of each continental group and determined the genetic profile of the ancestors. The analysis showed that some European groups, such as those from western Germany, Flemish Belgium, northwestern France, southern France and Spain, contributed significantly to the origins of almost all British clusters. Others contributed only to some specific clusters, for example, the Norwegian ones had a significant influence on the formation of clusters in Orkney and less in Scotland and Northern Ireland.
The gene pool reflects history
Genetic data has shown traces of migrations to the British Isles over the past 10 thousand years. Based on the nature of the influence of continental groups on British clusters, researchers distinguish the relative timing of migration events. Those groups whose contribution is found in all clusters obviously indicate more ancient migrations. Enough time has passed since then for their haplotypes to spread to other parts of Great Britain. The continental footprint in individual clusters is apparently the result of more recent migrations.

Major events in the settlement of the British Isles.
The most noticeable mark was left by the conquest of Britain by the Anglo-Saxons in the 5th century. The genetic contribution of Anglo-Saxon migration is significant in south-eastern, central and southern England, although nowhere does it exceed 50%, and in most areas it ranges from 10 to 40%. This indicates that the Anglo-Saxons did not completely displace the local population of the Britons (Celts), but mixed with them. Some clusters coincide topographically with the territories of Anglo-Saxon kingdoms and clans. It seems that these territories retained their ethnographic and genetic identity for many centuries, the researchers emphasize.
In the populations of the Orkney Islands, 25% of the gene pool is attributed to ancestors of Norse origin, these are traces of the invasion of the islands by the Norwegian Vikings, which occurred in the 9th century. Genetic data also indicate that the Norwegian Vikings did not displace the indigenous population, but mixed with it. But clear genetic traces of the Danish Vikings, who at the same time controlled a significant part of England, could not be found.
As for the earliest settlement of the British Isles - after the end of the last glaciation - its traces are best preserved in the populations of Wales. Evidence also points to significant subsequent migration from the continent, even before the conquest of Britain by the Roman Empire at the beginning of the first millennium AD. The genetic influence of this migration spread across England, Scotland and Northern Ireland, but largely bypassed Wales, which has the most ancient gene pool.
The authors of the study convincingly showed how genetics can complement and clarify archaeological and linguistic information in order to reconstruct the history of populations. Smart selection of source data and powerful statistical methods helped them obtain a detailed genetic map of the country and look into the past of the British population.
Source:
The fine-scale genetic structure of the British population
Stephen Leslie, Bruce Winney, Garrett Hellenthal, Dan Davison, Abdelhamid Boumertit, Tammy Day, Katarzyna Hutnik, Ellen C. Royrvik, Barry Cunliffe, Wellcome Trust Case Control Consortium, International Multiple Sclerosis Genetics Consortium, Daniel J. Lawson, Daniel Falush, Colin Freeman, Matti Pirinen, Simon Myers, Mark Robinson, Peter Donnelly & Walter Bodmer
Nature, 2015, v.519, 7543, doi:10.1038/nature14230
http://www.nature.com/nature/journal/v519/n7543/full/nature14230.html
We constantly hear that Russians are not a people united by blood, related by blood, but a conglomerate of people united by a common culture and territory. Everyone remembers Putin's catchphrases“There are no pure Russians!” and “scratch every Russian, you will certainly find a Tatar.”
They say that we are “very different in blood”, “we did not grow from the same root”, but were a melting pot for the Tatar, Caucasian, German, Finnish, Buryat, Mordovian and other peoples who have ever raided, entered, strayed on our land, and we received them all, let them into the house, took them into our family.
This has become almost an axiom among politicians who are blurring the concept of Russian, and at the same time for everyone it has become an entrance ticket to the environment of the Russian people.
This approach, raised to the flag by numerous Russophobic a la “human rights” organizations and Russian Russophobic media outlets, has filled the airwaves. But, sooner or later, Putin and others like him will have to answer for their words of humiliation of the Russian people. The scientists' verdict is merciless:
1) In 2009, a complete “reading” (sequencing) of the genome of a representative of the Russian ethnic group was completed. That is, the sequence of all six billion nucleotides in the Russian human genome has been determined. His entire genetic makeup is now in full view.
(The human genome consists of 23 pairs of chromosomes: 23 from the mother, 23 from the father. Each chromosome contains one DNA molecule formed by a chain of 50-250 million nucleotides. The genome of a Russian man was sequenced. The decoding of the Russian genome was carried out on the basis of the National Research Center "Kurchatov Institute", on the initiative of Corresponding Member of the Russian Academy of Sciences, Director of the National Research Center "Kurchatov Institute" Mikhail Kovalchuk According to information received in. Russian Academy Sciences, the Kurchatov Institute spent approximately $20 million on the purchase of sequencing equipment alone. The National Research Center “Kurchatov Institute” has a recognized scientific status in the world.)
It is known that this is the seventh deciphered genome beyond the Ural ridge: before that there were Yakuts, Buryats, Chinese, Kazakhs, Old Believers, Khanty. That is, all the prerequisites for the first ethnic map of Russia have been created. But all of these were, so to speak, composite genomes: pieces assembled after deciphering the genetic material different representatives the same population.
The complete genetic portrait of a particular Russian man is only the eighth in the world. Now there is someone to compare Russians with: an American, an African, a Korean, a European...
“We did not find any noticeable Tatar additions in the Russian genome, which refutes theories about the destructive influence of the Mongol yoke,” emphasizes the head of the genomic direction at the Kurchatov Institute Research Center, academician Konstantin Scriabin. -Siberians are genetically identical to Old Believers, they have one Russian genome. There are no differences between the genomes of Russians and Ukrainians - one genome. Our differences with the Poles are negligible.”
Academician Konstantin Scriabin believes that “in five to six years a genetic map of all peoples of the world will be drawn up - this is a decisive step towards understanding the susceptibility of any ethnic group to medicines, diseases and products.” Feel what it costs... Americans in the 1990s gave the following estimates: the cost of sequencing one nucleotide is $1; according to other sources - up to 3-5 dollars.
(Sequencing (reading the genetic code) of mitochondrial DNA and the DNA of the human Y chromosome is the most advanced DNA analysis method to date. Mitochondrial DNA is passed down through the female line from generation to generation practically unchanged since the time when “the ancestor of mankind, Eve "came down from the tree in East Africa. And the Y chromosome is present only in men and therefore is also passed on to male offspring almost unchanged, while all other chromosomes, when transmitted from father and mother to their children, are shuffled by nature, like a deck of cards before being dealt. Thus. , in contrast to indirect signs ( appearance, body proportions), sequencing of mitochondrial DNA and Y-chromosome DNA indisputably and directly indicate the degree of relatedness of people.)
2) Outstanding anthropologist, researcher of human biological nature, A.P. Bogdanov in late XIX century wrote: “We often use expressions: this is purely Russian beauty, this is the spitting image of a hare, a typically Russian face. You can be convinced that it is not something fantastic, but something real that lies in this in general terms Russian physiognomy. In each of us, in the sphere of our “unconscious”, there is a fairly definite concept of the Russian type” (A.P. Bogdanov, “Anthropological physiognomy.” M., 1878).
A hundred years later, and now the modern anthropologist V. Deryabin, using the latest method of mathematical multidimensional analysis of mixed characteristics, comes to the same conclusion: “The first and most important conclusion is to state the significant unity of Russians throughout Russia and the impossibility of identifying even the corresponding regional types, clearly limited from each other” (“Questions of Anthropology.” Issue 88, 1995). How is this Russian anthropological unity expressed, the unity of hereditary genetic characteristics expressed in the appearance of a person, in the structure of his body?
First of all, hair color and eye color, the shape of the skull structure. According to these characteristics, we Russians differ from both the European peoples and the Mongoloids. And we cannot be compared with Negroes and Semites at all, the differences are too striking. Academician V.P. Alekseev proved a high degree of similarity in the structure of the skull among all representatives of the modern Russian people, while clarifying that the “Proto-Slavic type” is very stable and has its roots in the Neolithic era, and possibly the Mesolithic. According to the calculations of the anthropologist Deryabin, light eyes (gray, gray-blue, light blue and blue) are found in 45 percent of Russians, in Western Europe Only 35 percent are light-eyed. Dark, black hair among Russians occurs in five percent of the population foreign Europe- in 45 percent. The popular opinion about the “snub nose” of Russians is also not confirmed. 75 percent of Russians have a straight nose profile.
Conclusion of anthropologists:
“Russians in their racial composition are typical Caucasians, who, according to most anthropological characteristics, occupy a central position among the peoples of Europe and are distinguished by slightly lighter pigmentation of their eyes and hair. One should also recognize the significant unity of the Russian racial type throughout European Russia.”
“A Russian is a European, but a European with physical characteristics unique to him. These signs make up what we call a typical hare.”
Anthropologists have seriously scratched the Russians, and there is no Tatar, that is, a Mongoloid, in the Russians. One of the typical features of a Mongoloid is the epicanthus - the Mongolian fold of the internal corner eyes. In typical Mongoloids, this fold occurs in 95 percent; in a study of eight and a half thousand Russians, such a fold was found in only 12 people, and in its rudimentary form.
Another example. Russians literally have special blood - the predominance of groups 1 and 2, which is evidenced by many years of practice at blood transfusion stations. Among Jews, for example, the predominant blood group is 4th, and the negative Rh factor is more common. During biochemical blood tests, it turned out that Russians, like everyone else, to the European peoples, is characterized by a special gene RN-c, this gene is practically absent in Mongoloids (O.V. Borisova “Polymorphism of erythrocyte acid phosphatase in various population groups Soviet Union" "Issues of Anthropology". Vol. 53, 1976).
It turns out that no matter how you scratch a Russian, you still won’t find a Tatar or anyone else in him. This is confirmed by the encyclopedia “Peoples of Russia”, in the chapter “Racial Composition of the Population of Russia” it is noted: “Representatives of the Caucasian race make up more than 90 percent of the country’s population and another 9 percent are representatives of forms mixed between Caucasoids and Mongoloids. The number of pure Mongoloids does not exceed 1 million people.” (“Peoples of Russia”. M., 1994).
It is easy to calculate that if there are 84 percent Russians in Russia, then all of them are exclusively people of the European type. The peoples of Siberia, the Volga region, the Caucasus, and the Urals represent a mixture of European and Mongolian races. This was beautifully expressed by anthropologist A.P. Bogdanov in the 19th century, studying the peoples of Russia, he wrote, refuting from his far, far away today’s myth that the Russians poured foreign blood into their people during the eras of invasions and colonization:
“Perhaps many Russians married natives and became sedentary, but the majority of the primitive Russian colonizers throughout Rus' and Siberia were not like that. They were a trading, industrial people, who cared about organizing themselves according to their own, in accordance with the ideal of well-being they had created for themselves. And this ideal of the Russian person is not at all such that he can easily twist his life with some kind of “trash,” just as even now Russian people often dishonor the non-religious. He will do business with him, will be affectionate and friendly with him, will become friendly with him in everything, except to become related, to introduce a foreign element into his family. For this, ordinary Russian people are still strong, and when it comes to the family, to the roots of their home, then they have a kind of aristocracy. Often villagers of different tribes live in the same neighborhood, but marriages between them are rare.”
For thousands of years, the Russian physical type remained stable and unchanged, and was never a cross between different tribes that at times inhabited our land. The myth is dispelled, we must understand that the call of blood is not an empty phrase, that our national performance about the Russian type - the reality of the Russian breed. We must learn to see this breed, admire it, appreciate it in our near and distant Russian relatives. And then, perhaps, ours will be reborn Russian appeal to complete strangers, but to our own people - father, mother, brother, sister, son and daughter. After all, we are actually all from a single root, from one clan - the Russian clan.
3) Anthropologists were able to identify the appearance of a typical Russian person. To do this, they had to convert all photographs from the photo library of the Museum of Anthropology with full-face and profile images to a single scale typical representatives population of the Russian regions of the country and, combining them along the pupils of the eyes, superimpose them on each other. The final photographic portraits turned out, naturally, blurry, but they gave an idea of the appearance of the standard Russian people. This was the first real sensational discovery. After all, similar attempts by French scientists led to a result that they had to hide from the citizens of their country: after thousands of combinations from the resulting photographs of the reference Jacques and Marianne, gray faceless ovals of faces were seen. Such a picture, even among the most distant Frenchmen from anthropology, could raise an unnecessary question: is there even a French nation?
Unfortunately, anthropologists did not go beyond creating photographic portraits of typical representatives of the Russian population of different regions of the country and did not superimpose them on each other in order to obtain the appearance of an absolute Russian person. In the end, they were forced to admit that such a photo could get them into trouble at work. By the way, “regional” sketches of Russian people were published in the general press only in 2002, and before that they were published in small editions only in scientific publications for specialists. Now you can judge for yourself how similar they are to the typical cinematic Ivanushka and Marya.
Unfortunately, mostly black and white old archival photographs of the faces of Russian people do not allow us to convey the height, build, color of skin, hair and eyes of a Russian person. However, anthropologists have created verbal portrait Russian men and women. They are of average build and average height, light brown-haired with light eyes - gray or blue. By the way, during the research a verbal portrait of a typical Ukrainian was also obtained. The standard Ukrainian differs from the Russian only in the color of his skin, hair and eyes - he is a dark brunette with regular facial features and brown eyes. A snub nose turned out to be absolutely uncharacteristic of an Eastern Slav (found in only 7% of Russians and Ukrainians); this feature is more typical for Germans (25%).
4) In 2000 " Russian Foundation Fundamental Research" allocated approximately half a million rubles from state budget funds for the study of the gene pool of the Russian people. It is impossible to implement a serious program with such funding. But this was more of a landmark decision than just a financial decision, indicating a change in the country’s scientific priorities. Scientists from the Laboratory of Human Population Genetics of the Medical Genetic Center of the Russian Academy of Medical Sciences, who received a grant from the Russian Foundation for Basic Research, national history were able to completely concentrate for three years on studying the gene pool of the Russian people, and not small nations. And limited funding only spurred their ingenuity. They supplemented their molecular genetic research with an analysis of the frequency distribution of Russian surnames in the country. This method was very cheap, but its information content exceeded all expectations: a comparison of the geography of surnames with the geography of genetic DNA markers showed their almost complete coincidence.
Unfortunately, interpretations of family analysis that appeared in the media after the first publication of data in a specialized scientific journal could create a false impression about the goals and results of the scientists’ enormous work. The project leader, Doctor of Sciences Elena Balanovskaya, explained that the main thing was not that the surname Smirnov turned out to be more common among Russian people than Ivanov, but that for the first time a complete list of truly Russian surnames was compiled by region of the country. First, lists were compiled for five conditional regions - Northern, Central, Central-Western, Central-Eastern and Southern. In total, across all regions there were about 15 thousand Russian surnames, most of which were found only in one of the regions and were absent in others. When superimposing regional lists on top of each other, scientists identified a total of 257 so-called “all-Russian surnames.” It's interesting that on final stage research, they decided to add the names of residents to the list of the Southern region Krasnodar region, expecting that the predominance of Ukrainian surnames of descendants Zaporozhye Cossacks, evicted here by Catherine II, will significantly reduce the all-Russian list. But this additional restriction reduced the list of all-Russian surnames by only 7 units - to 250. From which followed the obvious and not pleasant conclusion for everyone that Kuban was populated mainly by Russian people. Where did the Ukrainians go and were they even here at all is a big question.
Over the course of three years, participants in the Russian Gene Pool project walked through almost the entire European territory RF and made a very representative sample of Russian blood.
However, cheap indirect methods of studying the genetics of the Russian people (by surnames and dermatoglyphics) were only auxiliary for the first study in Russia of the gene pool of the titular nationality. His main molecular genetic results are available in the monograph “Russian Gene Pool” (Luch Publishing House). Unfortunately, due to a lack of government funding, scientists had to carry out part of the research together with foreign colleagues, who imposed a moratorium on many results until joint publications were published in the scientific press. Nothing prevents us from describing these data in words. Thus, according to the Y chromosome, the genetic distance between Russians and Finns is 30 conventional units. And the genetic distance between Russian people and the so-called Finno-Ugric peoples (Mari, Vepsians, etc.) living on the territory of the Russian Federation is 2-3 units. Simply put, genetically they are almost identical. The results of mitochondrial DNA analysis show that the Russians from the Tatars are at the same genetic distance of 30 conventional units that separates us from the Finns, but between the Ukrainians from Lviv and the Tatars the genetic distance is only 10 units. And at the same time, Ukrainians from the left bank of Ukraine are genetically as close to the Russians as the Komi-Zyrians, Mordovians and Maris.
http://topwar.ru/22730-geneticheskaya-karta-russkih.html
§1. Distances from three language families: FROM INDO-EUROPEAN: differences increase to the east - But most of the populations are genetically close; - FROM URAL: distances increase from east to west - But many populations are close - Finno-Ugric substrate among the Slavs and Turks; - FROM ALTAISKAYA: close only to themselves - No influence on neighbors in Europe
§2. Distances from Russians, Belarusians, Ukrainians: Classical markers - Northern Russians are further from average Russians than Ukrainians, Mordovians and Chuvashs - Autosomal DNA markers - Previous picture - Almost everyone is close to Russians - Except the Caucasus and the Urals - Y chromosome - The same picture with greater contrast - Distances from Belarusians - Similar only for the Slavs - The same picture for the Ukrainians - This means that the Eastern European populations are close to the Russians, and not to the Slavs in general!
DO LANGUAGES HAVE GENES?
We would like to immediately answer that the authors, like the reader, know that languages do not have genes. This is understandable even at the everyday level - how many Russians, scattered around the world in waves of the first, second and other emigrations, speak the most different languages! But their genes are still the same, inherited from their ancestors.
Then why are we talking about the genes of the Slavic or Germanic language family? Is this scientific? Quite. After all, we are engaged in population genetics and are talking only about the population of people who speak languages of the Slavic or Germanic branches of languages. And there is nothing else behind the “linguistic names”.
We have already said more than once that populations are multi-layered and can be of very different ranks - from elementary populations (several neighboring villages) to the population of all humanity. All these are populations, and they are nested into each other like nesting dolls: many populations of lower ranks fit into a population of the next higher rank, and so on. We roughly define one of these intermediate matryoshka populations based on ethnicity. This is the only reason why we can talk about the Russian gene pool - that is, about the population that is marked by people’s belonging to the Russian people. Moreover, this affiliation is determined by the people themselves, and in no case by genetics! And only after people have identified themselves as Russians or Norwegians (or reported that their grandparents thought about this), geneticists begin to impartially look: do and how much do the populations of Russians and Norwegians differ from each other? We conditionally call such populations “Russian” or “Norwegian”, while fully realizing that gene pools and populations are biological units that we give “humanitarian” names.
But let us emphasize that just because we named gene pools “Russian” or “Norwegian” does not mean that “Russian genes” or “Norwegian genes” suddenly appeared on the scene! There are no “Russian” or “Ukrainian” genes, just as there are no Slavic or Romance genes. No, if only because the genes are much older than the people and have scattered almost all over the world. However, we discuss these issues in the conclusion of the book (Chapter 10). And now it is only important for us to answer the question - if there are no Russian or Slavic genes, why do we call gene pools by such names?
WHY DO GENE POOLDS HAVE NAMES?
Only because populations (and their gene pools) need to be given understandable names. You can, of course, leave the gene pool nameless and keep repeating “the main rural old-timer population of the regions of the East European Plain and more northern regions, roughly comparable to the borders of the Russian state before Ivan the Terrible.” But even from such a phrase it will remain unclear who we are still analyzing (for example, whether we include Karelians, Izhoras, Tatars or Mordovians). And if we say (as we described in detail at the beginning of the book) that by the Russian gene pool we mean the indigenous rural Russians in their “original” (historical) area, and then use the term “Russian gene pool” throughout the book, then it will be easier for the reader will understand what the authors are talking about. That's why we give gene pools conventional names - for ease of mutual understanding.
However, in order to name nesting dolls of a higher rank, it is necessary to use some kind of population classification. In Chapter 2, for example, we tested how genetically efficient racial and linguistic classifications are. And among the peoples of Siberia, they tested the genetic effectiveness of classifying peoples by type of ornament and by type of shamanic drums. And it turned out that the ornament reveals populations poorly, but shamanic drums are no less effective for identifying populations than languages. But still, the linguistic classification has been developed in the most detail. This is why populations are often named after languages. This is now accepted in the biological sciences. And when we talk, for example, about the “Finno-Ugric” layer of the gene pool, both anthropologists and archaeologists understand us. They understand that we are talking about a certain population of people, quite extended in time and space. And it doesn’t matter that the Chuvash have now changed their previous language to Turkic, and it doesn’t matter that we don’t know what language the ancient populations spoke if they didn’t leave written evidence. A huge array of data from various sciences (including, for example, toponymy - the names of rivers or lakes) indicates that there was a community of people here, to which we now give the conventional name “Finno-Ugric” world.
Therefore, in both this and the next section, when comparing genetic distances from populations with “linguistic” names, we do not betray science, but follow its strict rules. Let's take the linguistic classification of peoples; then, in accordance with it, we give each group of populations a conditional “linguistic” name; and finally, we calculate the average gene frequencies for those populations from this group that live in the analyzed territory. And then we look at how different each Eastern European population is from these average frequencies of “Indo-European” or “Altai” population arrays. At the same time, the authors, like the reader, are aware that the Altai languages in Europe are spoken by peoples with completely different physical appearances - from the Gagauz to the Kalmyks. But we do not have the right on this basis to exclude anyone from those groups that linguistics has identified - we honestly list which peoples are included in the population with a given “linguistic” name.
WHAT DO DISTANCE MAPS TELL US?
Maps of genetic distances are almost more important than maps of principal components. These two basic tools of gene geography, used together, provide a complementary description of the gene pool. Principal component maps allow us to put forward hypotheses about the factors that formed the observed patterns, and genetic distance maps allow us to test these hypotheses.
Each genetic distance map presented in this section is the average for all studied loci (Table 8.1.1.). It clearly shows how genetically close each population in the area is to one population group specified by the researcher. Such a group of populations is called “reference”.
The gene pool can be asked: which populations are genetically close to the population group of interest to us? Which ones are relatively distant? And which ones are fundamentally different from the reference group, and in terms of the entire set of gene frequencies? And the map of genetic distances will give the answer: how genetically close or far each point on the map is from the reference group. We will see it with our own eyes.
Distance maps differ from the usual use of genetic distances in only one way, but the most important feature: when mapping, the analysis includes the population area, i.e., the geographic, spatial aspect.
A genetic distance map often reveals a relationship between genetic and geographic distances. The map demonstrates how, as we move away from the reference population (specified by the researcher), the population of adjacent and more distant territories becomes genetically more and more different from the reference population. However, this increase in genetic distances depends not only on geographical distance. Otherwise, any map of genetic distances would consist of concentric circles, similar to the circles diverging on water from a thrown stone.
In fact, distances in some directions may increase rapidly, indicating barriers to gene flow; in other directions the distances may hardly increase, demonstrating the genetic closeness of these adjacent groups. In a number of cases, the smooth course of isolines may be disrupted, and among genetically close groups a genetically distant population is identified, which may indicate, for example, its migration to this territory. Thus, plotting genetic distances on a map can provide valuable information about the relationships of the group under study with other populations of the region, the presence of genetic flows, genetic barriers, and related groups. Moreover, we also receive information about the reference group itself (for example, Russians or Belarusians): about genetic diversity within its boundaries, about deviations from average values within its own range.
NOT ONE CARD. AND A WHOLE FAN!
Mapping genetic distances clarifies many features of the gene pool - especially if we consider not one map of distances (from one people), but a series of maps - from different peoples, from major population groups. Each new map will tell about the genetic position of a new people or group of peoples in the general gene pool of the region. A comparison of the entire fan of maps will show how great the contribution of each of these groups to the Eastern European gene pool is and where the zones of their mixing lie.
We will not look here at maps of genetic distances from each people of Eastern Europe - that would take us too far beyond the scope of a book about the Russian gene pool. Maps of distances from groups of peoples related to each other are more informative. They reveal patterns of non-ethnogenesis individual peoples, but general events in the formation of the population of Eastern Europe. As we already described in Chapter 2, genogeography is based on the principle of “scaling”: as the scale of the studied groups increases, traces of increasingly ancient and large-scale events are revealed.
Therefore, attention is paid to maps of distances from groups of peoples. In §1, maps of the average gene frequencies of the peoples of the Indo-European, Ural and Altai language families inhabiting Eastern Europe are constructed. Then (§2) we look at maps of distances from the Russian people, showing their position in the general gene pool of Eastern Europe. And in conclusion, let's look at the maps of two other peoples of Eastern Europe - Belarusians and Ukrainians, who are historically close to Russian populations and may have a similar gene pool.
All cards are read the same. The further a given map point is genetically distant from the reference population, the greater the distance, the more intense the coloring of this point. Therefore, the lightest areas are the areas of smallest distances. These are the populations that are most similar to the reference one. The darkest areas are the areas of greatest distances. These are populations that are genetically different from the reference one. Of course. As soon as we take a different reference population, the same map points will report that they already have different distances to the new reference point. For ease of reading, all distance maps are built on a single scale, so you can safely compare not only different parts of one map, but also different maps with each other based on color intensity.
§1. Distances from three language families
Let's look at maps of genetic distances of all populations of Eastern Europe from the peoples of the Indo-European, Ural and Altai language families inhabiting it. For brevity, we present maps of one “eyewitness” - autosomal DNA markers, since maps of genetic distances for classical markers, as we will see in the next paragraph, are quite similar.
FROM THE PEOPLES OF THE INDO-EUROPEAN LANGUAGE FAMILY (DNA MARKERS)
A map of genetic distances from the Indo-European language family is presented in Fig. 8.3.1.
The map was built like this. First, the average frequencies of DNA markers were calculated for representatives of the Indo-European family in Eastern Europe: populations of Russians, Ukrainians, Belarusians, and Moldovans. Then, based on them, average “Indo-European” gene frequencies were obtained. Next, the genetic distances from these average “Indo-European” frequencies to the frequencies at each point on the map are calculated, and the resulting distance values are placed in the same map nodes.
Therefore, if, for example, in most of Belarus, in the regions of Kyiv and Lviv, the values of genetic distances fall in the range from 0.01 to 0.02 (Fig. 8.3.1.), this means that these are (on average for all genes) the differences between these populations from the average frequencies of the peoples of the Indo-European family. On the contrary, the differences between Kalmyks, Komi, and Bashkirs are much greater - the values of genetic distances in the territories of their settlement are more than 0.05 and 0.06. The rest of the genetic distance maps are read similarly.
The map demonstrates that, as one might expect, the populations of Russians in Central Russia, Ukrainians, Belarusians, and Moldovans (that is, the Indo-European populations themselves) are close to the average frequencies of the Indo-European peoples of Eastern Europe. However, not everything is predictable - the northern Russian populations (although they are Indo-Europeans) are noticeably different from the “average Indo-Europeans” - to the same extent as the non-Indo-European peoples of the middle Volga (Mari, Mordovians, Chuvash) and the Western Caucasus. Finally, the most different is the population of the Urals (especially the Komi), as well as the steppe peoples (Bashkirs, Kalmyks).
Let us pay attention to the populations of the Russian people. They represent Indo-European in Eastern Europe language family, their frequencies were used to calculate the average "Indo-European" frequencies. And, nevertheless, we see clear differences between Russian populations in the degree of proximity to their own reference population. This again indicates that the level of heterogeneity of the gene pool of the Russian people is so great that it is clearly manifested even on an Eastern European scale.
In general, a clear geographical pattern is revealed: when moving east, the distances gradually increase, the populations are increasingly different from the average characteristics of the Indo-European peoples, and the peoples of the eastern borders of Europe turn out to be the most genetically dissimilar to them. However, in general, most of the peoples of Eastern Europe (including the Ural and Caucasian populations) turn out to be close to the Indo-European peoples: the average value of genetic distances on the map is small d = 0.028.
FROM THE PEOPLES OF THE URAL LANGUAGE FAMILY (DNA MARKERS)
The following map of genetic distances is built from the average frequencies of genes of the Uralic language family and shows a different picture (Fig. 8.3.2.).
Of the Ural family, only the eastern Finnish-speaking peoples (Komi, Udmurts, Mari, Mordovians) have been studied using DNA markers. Minimum distances are found in the settlement areas of these peoples, mainly in the Urals. On the contrary, the population of the western Russian Plain and Ciscaucasia is genetically distant from the average Ural frequencies. The middle regions of Eastern Europe, geographically adjacent to the Urals, are closer to the Ural peoples genetically.
So, smallest values distances are localized in the Urals and gradually increase further to the west. Probably, the territories occupied by intermediate values reflect the area of the ancient Finno-Ugric tribes assimilated by the Slavs [Alekseeva, 1965]. It is curious that the areas of the Turkic-speaking peoples of the Urals are close to the characteristics of the Ural family, which is explained by the significant share of the Ural substrate in the gene pool of the Chuvash, Tatars, and some groups of Bashkirs [Roginsky, Levin, 1978].
The average distance on the map, although higher than that of the “Indo-European” ones, is small (d = 0.039). This confirms the significant representation of the Uralic-speaking gene pool in the general Eastern European gene pool, which largely consists of the Uralic substrate.
FROM THE PEOPLES OF THE ALTAI LANGUAGE FAMILY (DNA MARKERS)
The following map (Fig. 8.3.3.) demonstrates the differences between each Eastern European population and the peoples of the Altai language family. This family in Eastern Europe is represented mainly by Turkic-speaking peoples - only the Kalmyks speak a language belonging to the Mongolian group of this family.
The two previous maps of genetic distances (from the Indo-European and from the Uralic families) were characterized by small average distance values. On the maps (Fig. 8.3.1., 8.3.2.) this was noticeable by the predominance of light colors. On the contrary, on the map of distances from the Altai family (Fig. 8.3.3.) the dark color predominates, corresponding to the significant genetic distance of most Eastern European populations from the gene pool of the Altai linguistic family. Only the areas of the peoples of the Altai language family themselves are naturally close to their average values. And immediately outside the zone of their settlement, the remaining Eastern European populations turn out to be sharply different from the genetic characteristics of the Altai-speaking peoples.
This is reflected in the greater value of genetic distances than for previous maps. On average for the map they amounted to d = 0.064, which is almost three times higher than the similar value for the Indo-European peoples.
Thus, the influence of the peoples of the Altai family on the Eastern European gene pool is limited only to the zone of their settlement and, according to the data under consideration, is practically not traceable even in adjacent territories. This fact can be explained by the relatively late appearance in Eastern Europe of many tribes speaking languages of the Altai family [Peoples and Religions of the World, 1999], while both the Indo-European and Uralic families are languages of more ancient population Eastern Europe [Cheboksarov, Cheboksarova, 1971; Bunak, 1980].
§2. Distances from Russians, Belarusians, Ukrainians
So, we have learned the basic “composition” of the Eastern European gene pool - what main subgene pools are represented in it, in what “shares” they are “mixed”, and how these shares differ in different parts Eastern Europe. Now we can return to the main topic of our book and consider what is the position of all Eastern European populations relative to the Russians? Since this topic is leading, we will present genetic distances from Russian populations for three types of markers - classical markers, autosomal DNA markers and Y chromosome markers. And so that we do not confuse “purely Russian” features with “Slavic” ones, we will also look at maps of distances from historically close East Slavic peoples - Belarusians and Ukrainians.
FROM RUSSIAN POPULATIONS (CLASSICAL MARKERS)
A map of genetic distances from average Russian frequencies using classical markers shows the degree of similarity of each population in Eastern Europe to the Russian gene pool. The light area of greatest proximity to central Russian gene frequencies occupies the middle zone of Eastern Europe - from Belarus to the middle Volga (Fig. 8.3.4.). Dark tones are areas genetically distant from Russians. There are relatively few of them - in order of degree of distance from the Central Russian ones - these are the Crimea and the Black Sea region, the Lower Volga, the Baltic states, the Russian North, Fennoscandia and the genetically distant Urals.
The areas of Belarusians and Ukrainians show similarities with the Russian gene pool. Surprising are the sharp genetic differences between the Russian North and the northeast of Europe in general, including Vyatka, the ancient Novgorod colony.
Of course, indigenous Russian population, now living in these territories, to the greatest extent bears the features of the assimilated population. However, it is incredible that the contribution of the Finno-Ugric population here was higher than in the populations of the Mordovians and Chuvash, which on the map are completely included in the “Central Russian genetic region”. There are three possible sources of such differences. Firstly, the Finno-Ugric substrate itself may gravitate towards Western Finnish-speaking peoples, and not towards Eastern ones.
Secondly, as archaeological data indicate [Sedov, 1999], Novgorod colonization had a different source for the Slavic tribes themselves. This means that not only the substrate, but also the Slavic superstrate could be unique in the Russian North. Thirdly, in small northern populations the factor of genetic drift is more powerful, which could also “attribute” them from the main Russian mainland. Most likely, all three factors acted in parallel, but the task of future research is to clarify their real relationship. Here, uniparental markers can be of great help, helping to differentiate migration flows in space and time.
Proximity to the “Central Russian” frequencies is demonstrated by a variety of parts of the Russian area, including those on which the opposite extremes of the main components of the Eastern European gene pool are located (section 8.2.). This picture can be explained based on the hypothesis that the “Central Russian” frequencies themselves are essentially “Central European”, and the Russian gene pool is formed by mixtures of a wide variety of Eastern European components (Finno-Ugric, Slavic, Baltic, etc.). This hypothesis is also confirmed in maps of genetic distances from Ukrainians, Belarusians and Russians according to the most informative DNA marker - Y chromosome haplogroups.
FROM RUSSIAN POPULATION (AUTOSOMAL DNA MARKERS)
As with the data on classical markers (Fig. 8.3.4), the population of Central Russia is again close to the average Russian gene frequencies (Fig. 8.3.5.). Belarusians, who in terms of frequencies of classical markers are practically indistinguishable from Central Russian characteristics, and according to DNA data show slight differences. The populations of the Urals, the Caucasus, the Volga region and, to a lesser extent, the Russian North are quite different from the average Russian frequencies. Thus, in all main points, the use of DNA and classical markers leads to similar results. The differences between the two maps, in our opinion, are caused mainly by the degree of study of the markers different types, and it can be expected that as data on DNA polymorphism accumulates, the picture of their variability will become increasingly closer to the results obtained using classical markers.
The average genetic distance of Eastern European populations from Russian frequencies is small (d = 0.28), which may be the result of long-term interaction of the Russian gene pool with the environment. Let us recall that the distances from the Indo-European peoples are generally characterized by the same average size(d=0.28). When comparing these maps (Fig. 8.3.1. and 8.3.5), their significant similarity becomes obvious. This is understandable, since Russians are also Indo-Europeans and frequencies in Russian populations were included in the calculation for Indo-European peoples. It is curious that the differences between the Russian populations between the Volga and Vyatka, marked on the map of distances from the average frequencies of the Indo-European peoples, are also preserved on the map of distances from the average Russian frequencies.
So, the Russian gene pool turns out to be closely related to the gene pools of many Eastern European peoples - in terms of gene frequencies, Belarusian, Ukrainian, Mordovian and many other Eastern European populations are extremely close to Russians. Only as one approaches the Caucasus and the Urals does the population’s gene pool become clearly different from the average characteristics of the Russian gene pool. This result is not unexpected, since Russian settlement over vast territories and intensive exchange of genes outside the “original” area with surrounding peoples are obvious. It seems rather interesting fact, that the genogeographic maps showed the presence of two mountain barriers (the Caucasus and the Urals), to some extent limiting this spatial expansion of the gene pool.
FROM RUSSIAN POPULATIONS (Y CHROMOSOME MARKERS)
This card is different in two ways. Firstly, on it we see all of Europe, and not just its eastern half (the map is built on the basis of those eight maps of individual haplogroups, which were discussed in section 6.3). Secondly, the differentiating ability of Y chromosome markers is much higher, so the differences between Russian populations and their neighbors are more pronounced. Despite even the “wider” scale of intervals, the interval of maximum distances dominates on the map - according to the Y chromosome markers, almost all of Europe turns out to be significantly different from the Russian gene pool (Fig. 8.3.6). Only the Russian populations themselves and Belarusians are closest to the average Russian frequencies; the average degree of closeness is shown by the Ukrainians, Western Slavic peoples(Poles, Czechs, Slovaks) and the peoples of the Volga region. As in previous maps, northern Russian populations show pronounced distinctiveness, differing sharply from the average Russian gene pool.
We see that the Y chromosome markers confirm the previously identified patterns of similarity of the “Central Russian” gene pool with other East Slavic peoples and the peoples of the Volga region and the differences of the Russian North. The high information content of the Y chromosome makes these patterns more convex than for other types of markers, and consideration on a scale throughout Europe adds the Poles to the list of peoples similar to the Russian gene pool.
FROM BELARUSIANS (CLASSIC MARKERS)
On previous maps (Fig. 8.3.4., 8.3.5., 8.3.6.) we saw that many populations of Eastern Europe are similar to the Russian gene pool.
It is important to understand: are all these populations close to the Russian gene pool or to to a wide circle East Slavic populations? In other words: does the secret of this similarity lie in ethnic history Russian people or in the expansion of the Eastern Slavs as a whole, and perhaps in the “original”, before the expansion, similarity of the Slavic and Finno-Ugric gene pools?
To answer this question, we analyzed the proximity of the Eastern European gene pool to the Belarusians - another East Slavic ethnic group, very close in geography, ethnogenesis and anthropological type to the Russian people.
In Fig. 8.3.7. a map of genetic distances of Eastern European populations from average Belarusian gene frequencies is shown for a large set of classical gene markers - 57 alleles of 21 loci. We see a clear picture, fundamentally different from the nature of variability in the Russian gene pool. Almost all regions whose population demonstrates the greatest proximity to the Belarusian gene pool are located on the territory of Belarus itself. Outside the Belarusian area, genetic distances quickly increase to significant values, indicating clear genetic differences between the gene pool of Belarusians and the Eastern European gene pool as a whole.
The map records the genetic uniqueness of the gene pool of Belarusians, which indicates the high sensitivity of the genetic distance method. Note that the clear differences between the Belarusian gene pool and the gene pool of neighboring territories are an important unexpected result, since anthropological data usually fail to identify pronounced differences between Belarusians and neighboring groups [Alekseeva, 1973; Deryabin, 1999]. Of course, this genetic uniqueness of Belarusians is very relative: it manifests itself only on a Belarusian scale, as if through a microscope, thanks to the enormous resolution of maps to see even subtle details. Let us recall that on a different scale - on maps of genetic distances from Russians - Belarusians are practically indistinguishable from Russians in Central Russia. In any case, Belarusians are much more similar to them than the Russian populations of the Russian North themselves.
Thus, unlike the Russian one, the Belarusian gene pool is not close to the Eastern European gene pool as a whole. Consequently, the high genetic similarity of Russian populations with the population of most Eastern European territories is not a trait common to all East Slavic peoples, but its own characteristic of the Russian gene pool.
FROM BELARUSIANS (Y CHROMOSOME MARKERS)
This conclusion is confirmed by data on the Y chromosome. The map of distances from Belarusians (Fig. 8.3.8.) is built on the same interval scale as from Russians (Fig. 8.3.6.). But the zone genetically similar to the Belarusian gene pool is noticeably smaller: it includes only Slavic peoples (both Eastern Slavs, except Western Ukraine, and Western Slavic populations), but does not include the peoples of the Volga region and the Urals. Thus, genetic commonality with non-Slavic-speaking populations of Eastern Europe is the “prerogative” of the Russian gene pool, in contrast to the gene pool of Belarusians, which differs sharply from these peoples of the Volga region and the Urals.
FROM UKRAINIANS (Y CHROMOSOME MARKERS)
To complete the consideration of the East Slavic peoples, we also present a map of distances from Ukrainians (Fig. 8.3.9.). It is very reminiscent of the map from the Belarusians just discussed, only the zone of maximum proximity is shifted to the range of the Ukrainians themselves, and this zone also includes the southern Russian and Belarusian populations. And the non-Slavic peoples of Eastern Europe, which are relatively close to Russian populations, are as far from the Ukrainian gene pool as they are from the gene pool of Belarusians. This confirms the correctness of our interpretation that the Slavic colonization of the East European Plain, accompanied by the assimilation of the Finno-Ugric population, involved mainly the ancestors of the modern Russian population from the entire Slavic massif.


We also recommend
 Temple of the Tikhvin Icon of the Mother of God on Ave.
 The miraculous icon of St. Nicholas of Zaraisk St. Nicholas of Zaraisk with life
 How to smoke cheek meat at home
 Receiving a property deduction through an employer
 Interpretation of sleep to treat in dream books
 Buckwheat in a frying pan with onions and carrots Cook buckwheat with carrots and onions