Methods of analysis of financial and economic activity of the enterprise. Analysis of the financial and economic activities of an enterprise (organization, firm)
Instruction
Remember that when analyzing the activities of an enterprise, the principle of economic efficiency is used, which involves achieving best result at the lowest cost. The most general indicator of efficiency is profitability. Its specific features include:
- efficiency of use of labor resources (profitability of personnel, labor productivity), the main production assets(capital intensity, capital productivity), material resources (material intensity, material productivity);
- the effectiveness of the investment activity of the enterprise (payback);
- efficient use of assets (turnover indicators);
- efficiency of capital use.
After calculating the system of coefficients for the financial and economic activity of the enterprise, compare them with planned, normative and industry indicators. This will make it possible to draw a conclusion about the effectiveness of the functioning of the organization and its place in the market.
To draw a general conclusion about the efficiency of the enterprise, calculate the level of profitability, which is the ratio of the profit of the enterprise to the value of fixed and working capital. This indicator combines a number of coefficients (return on capital, sales, goods, etc.). Profitability is an integral indicator. It shows the measure of its attractiveness to investors.
When analyzing the activities of the enterprise, please note that for a more detailed study of its condition, it is necessary to conduct factor analysis the results obtained. After all, each indicator that reflects the use of production resources is influenced by other indicators.
note
The performance of an organization as a whole is influenced by many factors:
- general economic situation in the country and in the market;
- natural and geographical position of the enterprise;
- industry affiliation;
- factors determined by the functioning of the enterprise (price and marketing policy, the degree of use of production resources, the identification and use of on-farm reserves, etc.).
Entrepreneurial activity requires constant planning and analysis of the financial performance of the company. This is the basis for effective management of all stages of production and the development of methods for obtaining the greatest profit.
Instruction
To determine the stability of the financial condition of the enterprise, changes in the structure of capital, sources of its formation and direction of placement, the efficiency and intensity of the use of capital, the solvency and creditworthiness of the organization, the margin of its financial strength.
When conducting financial analysis determine the absolute and changes in indicators. The latter enable them to assess the risk of bankruptcy with generally accepted standards, with indicators of other enterprises in order to identify its strengths and weaknesses, place in the market, as well as with similar periods of previous years, in order to identify development trends of the company.
Then the selection of indicators is carried out, which financial enterprise: financial stability (financial stability ratio, autonomy, the share of receivables,), solvency and liquidity, business activity (turnover ratio of inventories, equity, etc.), profitability.
After that, it is made general scheme system, its main components, functions, relationships are distinguished, subordinate elements are determined that give qualitative and quantitative characteristics. Then they receive specific data on the work of the enterprise in numerical terms, evaluate the results of its activities, and identify reserves to improve production efficiency.
One of the objectives of the company is to survive in a competitive environment. From this point of view, under analysis market this refers to the collection and analysis of information that helps develop a survival strategy. To account for competitive threats, you can use the five forces theory of Michael Porter.

Instruction
Analyze the threat of new competitors. It is necessary to assess how easy or difficult it is for them to acquire the necessary equipment, skills, etc., so that they can. If the barriers to entry in an industry are low, competition can intensify. In this case, the company's management must decide in advance whether there is a chance of winning price wars.
Find out the threat of substitute products. If the company is into tinplate packaging, customers can switch to cheap plastic packaging. A decrease in demand for tinplate is possible, then competition between manufacturers will increase in proportion to demand. By analogy, make an analysis of the conditions in which the company.
Analyze rivalry between existing firms. The severity of the rivalry depends on the forces analyzed in the 4 previous steps.
Choose the right development strategy. If the 5 forces in an industry indicate high competition, a company should be prepared to pursue low-cost production and provide additional, problem-solving customers.
Consider imposing strict rules. A company may lobby for laws that competitors will find difficult to enforce. Then the 5 forces acting in the market will change the degree of influence on each other.
Useful advice
The theory of five forces is described in detail in Stephen Silbiger's book "MBA in 10 days", 2002, in the "Strategy" section. Pay attention to the determinants of the five powers. They allow you to think in the right direction to find opportunities for competitive advantage.
The main activity of the enterprise is the main source of profit. The nature of the activity is determined by the industry specifics of the enterprise, which is based on industrial and commercial activities, and is supplemented by investment and financial activities. The profit received from the sale of manufactured products, services and works is determined by the difference between the proceeds and the cost, less taxes and other obligatory payments.

Instruction
Neutral - without benefit to any one group;
Understandable - easily perceived without special training;
Comparable, for example, with information from other organizations;
Rational, the selection of which would be carried out at minimal cost;
Confidential - i.e. did not contain data that could harm the company and its strong position.
Carry out analytical data processing with the preparation of analytical tables and a balance sheet, where articles are summarized in enlarged groups with the same economic content. Such a balance is convenient for reading and conducting a qualitative economic analysis.
Based on the groups obtained, calculate the main indicators of the financial condition of the enterprise - liquidity, financial stability, turnover, etc. Please note that with this transformation of the balance, the balance is preserved - the equality of the asset and liability.
Conduct vertical and horizontal balance sheet analysis. In a vertical analysis, take the amount of assets and revenue as 100% and divide the interest by item according to the figures presented. In a horizontal analysis, compare the main balance sheet items with previous years by placing them in adjacent columns.
Compare all metrics against industry benchmarks.
Summarize the results of the economic analysis. Based on the information received, give an objective assessment of the enterprise's activities, make proposals for identifying reserves to improve the efficiency of the enterprise.
Related videos
Analysis of product sales will help you identify the most promising products in terms of their implementation. It also allows you to track the trends of decline and growth in sales. With this information, you will be able to manage your sales and plan your business more effectively. professional activity.

You will need
- Sales information, calculator, computer
Instruction
Analyze the dynamics and structure of product sales. To do this, keep track of how many units of products were purchased during the reporting period. Compare the received data with the previous or base period. The result may be a conclusion about the growth, decline or stability of sales. Determine the rate of revenue growth by dividing the data for the current period by the data for the past. Find out how many products were sold on credit.
Determine the critical sales volume. This indicator shows at what quantity of products sold the enterprise will cease to be unprofitable, but will not yet begin to make a profit. For this fixed costs should be divided by the level of marginal income.
Analyze competitors' sales growth rates. This will allow you to identify your position in the market and strengthen the position of the company in the future.
Identify the reasons for the decline in sales, if any. Most often they are the approach of the product life cycle to the end, high competition in this market sector, market glut. Depending on the reason, the company must either launch a new product, or strengthen its strengths, or enter new market segments. A timely decision can save you from a further decline in sales.
note
The term "sales analysis" refers to a very wide range of tasks, including those that require the use of non-trivial techniques. However, in most cases, the analyst or sales manager is satisfied with the use of spreadsheets filled with ... information.
Useful advice
At the initial stage, the analysis of sales dynamics, sales structure and profitability of sales is carried out. At this stage, the trends that are emerging in relation to sales (growth, stability, decline) are determined, as well as the influence of individual groups and categories of products / services on these trends and the level of this influence.
Sources:
- Sales analysis and management decisions
To identify an uptrend or downtrend sales products of the enterprise must be carried out analysis. It allows you to determine the situation on the market and identify those products, the promotion of which requires some effort. As a result, a plan for future sales and the necessary measures to increase them.

Instruction
Make a report on dynamics and structure sales in general for the enterprise and for individual areas and product groups. Calculate the rate of revenue growth, which is equal to the ratio of profit from sales in the current and past period. Also determine the percentage of revenue from sales products sold on credit in the reporting period. The obtained indicators, calculated in dynamics, will allow assessing the need for lending to customers and development trends sales.
Calculate the coefficient of variation sales. It is equal to the sum of the squares of the difference in sales in a particular period and the average number sales, in relation to the average percentage sales per analysis period. Based on the obtained values, draw conclusions about the reasons that cause unevenness. sales. Develop interventions to address the identified causes and increase rhythm.
Calculate the level of marginal income, which is equal to the ratio of the difference in revenue and variable costs to revenue from sales. Determine the Critical Volume Index sales, which is equal to the ratio fixed costs on the production and sale of products to the level of marginal income. The resulting value allows you to determine the break-even point of volume sales. Based on the data obtained, determine the margin of safety of the enterprise.
Define profitability in dynamics sales, which is defined as the ratio of profit sales to revenue. The resulting indicator allows you to determine the profitability of the enterprise and evaluate the effectiveness of the functioning and current product policy.
Pro analysis check the obtained indicators sales and identify measures that need to be taken to increase profits. It can be production optimization, work with clients, development of new ones and much more.
Profitability is an indicator of the profitability of the enterprise. Also, it is profitability that implies the use of certain funds in which the organization can cover its own costs with income and make a profit.

Instruction
Spend analysis profitability companies according to its activities for the year, and then by quarters. Compare actual performance profitability(products, property, own funds) for the required period with calculated (planned) indicators and with values for previous periods. At the same time, bring the values for previous periods to a comparable form using the price index.
Examine the impact of internal and external factors of production on performance profitability. Then determine the reserves for the growth of indicators profitability. On the other hand, in order to increase profitability, the rate must be greater than the growth rate of the materials used or the results of activities, that is, income from the sale of goods.
Pro analysis check the stability of the enterprise, which is characterized by many different indicators that reflect the stability of the state of its finances, the optimal level. aim analysis and finance is an assessment of the state of the company in the previous period, an assessment of its state at the moment and an assessment of the future position of the company.
Analysis is more difficult than comparing quantitative indicators, but it allows you to assess the situation at a different level. Why can't it be ignored? Firstly, the sales market has boundaries, it is necessary to work with it constantly, seeking opportunities for the best use of the market situation. Secondly, external conditions that are beyond your control may change. For example, a competitor has a new product in the same price range as yours, but best quality. Now for sales and a unit of goods will have to invest much more resources, for example, instead of 10 calls, you need to make 15. In a situation of intense competition, the advantage is given to a company whose specialists clearly formulate quality indicators and develop methods for monitoring them and working to improve these indicators.
Analyze the work of employees at different stages. This will allow you to identify at what stage a particular seller has difficulties. One finds himself and the company more difficult, the other finds it more difficult to work with objections. Thus, you will have before your eyes an individual profile of each employee. You will be able to work with the difficulties of each of them, improving the qualifications of an employee, forming skills that he does not possess at the time of the assessment.
How to conduct a personnel analysis in a company is a question that almost no one knows how to solve. Meanwhile, conducting a personnel analysis allows you to properly delegate authority to your employees.

Many methods are cumbersome and not universal, and also require a lot of labor for execution. But personnel analysis is carried out daily, including during interviews with candidates for employment in the company. Let's look at a simple method today that you can apply tomorrow.
Motivation/Competence Matrix
I learned this method in a training session by Michael Beng, who is a recognized master in training and motivating sales people. So let's go.
We constantly instruct employees to perform some tasks, but in the end we often do not get a satisfactory result. Most likely, the reason is that we gave this task to an incompetent or unwilling employee, and at the same time we did not control him. But there is a second option: we entrusted the work to a well-trained and independent responsible employee and at the same time constantly monitored him, as a result of which, his motivation decreased.

It is very important that your management style matches the motivation and competence of the person. We can use the Competence/Motivation Matrix to determine the position of an employee and determine the right actions in relation to him.
What do these two qualities depend on?
Competence - depends on the experience, education, training, intelligence of a person.
Motivation - depends on the person's goals, confidence, the attitude of the management towards him, on whether he is satisfied with the working conditions and the amount of payment.
STEP 1. We need to perform a job analysis, take into account the motivation and competence of the person without prejudice and place the person in one of the squares in the figure below.
STEP 2. You need to decide on the management style of each type of employee, the tips are in the corresponding squares of the bottom figure.
Let's take a closer look at the types:
1 are experienced competent employees who are motivated to do their job well. As a rule, these are TOPs and stars of divisions. Such an employee needs confirmation of his qualities in the form of obtaining greater powers within the framework of the project.
2 - these are employees who are eager to fight, but do not have the appropriate skills and experience and therefore constantly mess up. Either these are new employees who have not yet learned to work according to the company's standards, they need help in this. In my opinion, these are the most promising employees, from which you can grow type 1, just by teaching them how to work.
Type 3 is very dangerous. These are employees who have experience and competence, but are underestimated in the truest sense of the word or in their own opinion. Perhaps this employee was not promoted somewhere in time, or he is underpaid, perhaps you controlled him too much when he was in square 1. These are often presumptuous sales stars who were brought down from heaven to earth during the rotation in the department or the transformation of the sales department.
How to work with such employees?
Well, first of all, don't bring it up. Type 3 employees are the fault of their immediate supervisor. Here, either the employee was promised “mountains of gold” when applying for a job, which are not in this company. Or they did not catch the moment when the employee changed his motivation, and continued to motivate him incorrectly.

What can be done? Often, to motivate such employees, you need a shake-up with the opportunity to earn a reward and return to square 1 again.
If an employee became like this as a result of cheating in hiring and, as a result, inflated expectations, then it is best to say goodbye to him. If you cannot give him the powers or money he needs, he will leave anyway or work half-heartedly.
Advice for this paragraph: never hire an employee for a position if it does not provide for payment of the money that is interesting to him!
4 - this may be a new employee who was brought to the wrong place by fate or an old employee who has not developed competencies in himself, plus everything has lost motivation. This is the most difficult type of employee and needs to be transferred to other sectors as quickly as possible, but it is easier to replace them with type 2.
Next, you take a snapshot of the staff on a monthly basis and every time you take on a serious assignment, you analyze a specific employee. You must be sure that as an employee changes as a result of motivation and training, your management style also changes.
Summary
We have discussed with you how to analyze the personnel in the organization and delegate. A constant understanding of the motivation and competence of employees will allow you to find the right approach to each of them and manage them correctly.
Related videos
Introduction
Characteristics of the financial and economic activities of Rusimport-Irkutsk Trading House LLC
3. Measures to improve the financial condition of the enterprise LLC "Trading House" Rusimport-Irkutsk "
Conclusion
List of sources
Applications
Introduction
In a market economy, economists, managers, accountants, auditors must master the latest methods of economic analysis, correctly use economic information in the analysis; apply analysis tools more effectively in practice; comprehend the very methodology of analysis of financial and economic activity; correctly assess the financial stability and solvency of the organization.
The financial position of the enterprise must be analyzed from the standpoint of both short-term and long-term prospects, since the criteria for its assessment may be different. The state of the finances of an enterprise is characterized by the placement of its funds and the sources of their formation, the analysis of the financial condition is carried out in order to establish how efficiently the financial resources at the disposal of the enterprise are used. The financial efficiency of the enterprise is reflected by: the availability of own working capital and their safety, the state of normalized stocks of inventory items, the state and dynamics of receivables and payables, the turnover of working capital, material support of bank loans, solvency.
For normal functioning, ensuring the timeliness of settlements with suppliers, buyers, other business entities, the financial system, banks and employees, the enterprise has certain financial resources. The financial potential of the enterprise is formed in such a way as to ensure a steady increase in output, turnover, income, profits, and other indicators of economic activity while improving the quality and efficiency of management.
Consequently, the financial position of the enterprise must be studied simultaneously with the analysis of the implementation of plans, forecasts, the dynamics of the main indicators of its economic and social development.
The purpose of the practice report is to analyze the financial stability and solvency of the enterprise and develop measures to improve the financial results of Rusimport-Irkutsk Trading House LLC.
In the framework of this work, it seems appropriate to consider the following list of logically interconnected tasks:
1.Conduct an analysis of the management of the financial condition of the enterprise LLC "Trading House" Rusimport-Irkutsk ";
2.To develop the main directions for optimizing the financial condition of Rusimport-Irkutsk Trading House LLC.
The subject of the study is the management of the financial condition of the enterprise.
The object of the study is the analysis of the management of the financial condition of the enterprise OOO Trading House Rusimport-Irkutsk.
The information base for the analysis of the financial and economic activities of the enterprise was made up of the accounting financial statements of Rusimport-Irkutsk Trading House LLC for the period 2010-2012.
1. Characteristics of the financial and economic activities of Rusimport-Irkutsk Trading House LLC
Limited Liability Company "Trading House "Rusimport-Irkutsk" currently specializes in the wholesale and retail sale of alcoholic and tobacco products.
According to the charter, the main goal of Rusimport-Irkutsk Trading House LLC is to satisfy the needs of consumers, which implies constant updating of the assortment, maintaining a stable, relatively low price, as well as making a profit.
The main objectives of the LLC "Trading House "Rusimport-Irkutsk" are:
-study of requests and needs for goods with a focus on purchasing power;
-definition of assortment policy;
-creation of economic relations;
-formation and regulation of the processes of supply, storage, preparation for sale and sale of goods in conjunction with the goals of the enterprise;
-ensuring the specified turnover of material and labor resources.
The commercial activities of Rusimport-Irkutsk Trading House LLC are based on commodity market research: analysis of market processes, study of supply and demand for goods, cause-and-effect relationships, the nature and prerequisites for the development of target markets. The first task is to assess the market environment: the state of the real market situation, competitive strategy and commercial conditions, the second task is to identify the structure of supply and demand, their combinations and balance, the third is to develop alternative solutions for the surveyed objects and their use in the forecast period.
In accordance with the objectives of its activities, Rusimport-Irkutsk Trading House LLC cooperates with legal and individuals. On a contractual basis, determines the relationship with suppliers and buyers, as well as independently plans and carries out economic activities. The property of the company belongs to him on the right of ownership, and was formed from the contributions of the founders to the authorized capital. The founders have the right once a year to make a decision on the distribution of their net profit received by the Company after paying taxes and other obligatory payments to state non-budgetary funds among the participants, the formation of the Company's funds. The decision to determine the part of the profit divided between its participants is made by the General Meeting of Participants. The property owned by the Company is recorded on its balance sheet in accordance with the accounting rules. The authorized capital determines the minimum amount of the Company's property that guarantees the interests of its creditors.
The Company has complete economic independence in matters of determining the form of management, the structure of the Company, making business decisions, marketing, setting prices, wages, and distributing net profit. Transactions in which there is an interest of the director of the company, as well as major transactions, are made only with the consent of the LLC participant. The company provides, guaranteed by law, the minimum wage, working conditions and measures social protection employees. The Company keeps records of the results of its activities, maintains the established accounting and statistical reporting and is responsible for their accuracy. The liquidation of the company will be carried out by the liquidation commission, which is formed by decision general meeting members of the Society.
2. Analysis of the financial and economic activities of the enterprise
1 Organizational structure of enterprise management
The enterprise has highly qualified specialists in the field of trade, sales and contracting; necessary equipment, point-of-sale promotion activated, high quality service, all this helps to meet the most demanding requirements of potential buyers.
The existing organizational structure for managing the organization LLC Trading House Rusimport-Irkutsk is shown in Figure 2.1.
Rice. 2.1 Organizational management structure of Rusimport-Irkutsk Trading House LLC
The management structure of Rusimport-Irkutsk Trading House LLC is linear-functional. With this type organizational structure of the enterprise, the line manager, who reports directly to the director, is assisted by subordinate employees of the department in developing specific issues and preparing appropriate decisions, programs and plans.
The organization is headed by the General Director, who is subordinate to the employees of the organization and administrative and managerial personnel.
CEO is the sole executive body of the company. The competence of the General Director includes all issues of managing the current activities of the company, with the exception of issues related to the exclusive competence of the general meeting of participants. The General Director organizes the implementation of the decisions of the general meeting of participants. Functional divisions carry out all the technical preparation of production, prepare options for solving issues related to the management of trade processes, partially relieve line managers from planning financial calculations, logistics of production and other issues. The commercial department of Rusimport-Irkutsk Trading House LLC consists of the procurement department and the sales department. There is no marketing department. The organization of procurement of material resources is centralized, since the employees of the department report directly to the management of the department. The heads of the purchasing and sales department are responsible for the efficiency of the procurement process, outline the main sources of material support, coordinate the activities of their subordinate employees, link purchase and sales plans with the activities of other functional units, and select personnel.
Operational and supply work at the enterprise is carried out by employees of the department: a forwarder, a merchandiser-storekeeper, a commercial purchasing agent. Forwarder and commercial agent are looking for suppliers; together with the commercial director conclude contracts with them, draw up documentation for the acquisition of material resources, order transport for transportation (if necessary). Accompany goods on the way and ensure their safety.
The merchandiser-storekeeper determines the requirements for the products necessary for trade.
2.2 Financial analysis of the enterprise
According to the financial statements, an analytical balance sheet is built and an overall assessment of the financial position of the organization is given, as well as the condition and use of the organization's property is assessed.
Analysis of the financial position and performance of Rusimport-Irkutsk Trading House LLC was carried out for the period 01/01/2011-12/31/2012 (2 years). A qualitative assessment of the values of the organization's financial indicators was carried out taking into account the industry specifics of the organization's activities (industry - Wholesale trade in alcoholic and other drinks, OKVED code 51.34).
1 The structure of property and sources of its formation
IndicatorValue of the indicatorChange for the analyzed period in thousand rubles in % of the balance sheet thousand rub. (column 4-column 2)± % ((column 4-column 2) : gr.2) 12/31/201012/31/201112/31/2012 at the beginning of the analyzed period (12/31/2010) at the end of the analyzed period (12/31/2012) Active1. Non-current assets3 6234 8525 68612.217.8+2,063+56.9 including: fixed assets3 0784 1925 01610.415.7+1,938+63 intangible assets -------2. Current, total25 98519 91726 29787.882.2+312+1.2 including: inventories6 0357 1487 33420.422.9+1 299+21.5 accounts receivable18 74111 48012 95563.340.5-5 786-30.9 cash and short-term financial investments3,591,095,0251.215.7+4,666+14 times Liabilities1. Own capital2 5736 1879 5058.729.7+6,932+3.7 times rub. (column 4-column 2)± % ((column 4-column 2) : gr.2) 12/31/201012/31/201112/31/2012 at the beginning of the analyzed period (12/31/2010) at the end of the analyzed period (12/31/2012) Active1. Non-current assets3 6234 8525 68612.217.8+2,063+56.92. Long-term liabilities, total - 2,0162,061-6.4+2,061 - including: borrowed funds - 2,0002,000-6.3+2,000-3. Short-term liabilities*, total27 03516 56620 41791.363.8-6 618-24.5 including: borrowed funds7 476--25.2--7 476-100 Balance currency29 60824 76931 983100100+2 375+8 * Excluding deferred income included in equity
Assets on the last day of the analyzed period are characterized by the ratio: 17.8% of non-current assets and 82.2% of current ones. The assets of the organization for the entire analyzed period increased by 2,375 thousand rubles. (by 8%). Noting the increase in assets, it should be taken into account that equity increased even more - 3.7 times. The leading increase in equity relative to the total change in assets is a positive factor.
The ratio of the main groups of the organization's assets is clearly shown below in the diagram of Figure 2.2.
Rice. 2.2 The ratio of the main groups of assets of the organization
The growth in the value of the organization's assets is associated, first of all, with the growth of the following positions of the balance sheet asset (in parentheses is the share of the change in the item in the total amount of all positively changed items):
-short-term financial investments (excluding cash equivalents) - 3,921 thousand rubles. (48%);
-fixed assets - 1,938 thousand rubles. (23.7%);
-reserves - 1,299 thousand rubles. (15.9%);
-cash and cash equivalents - 745 thousand rubles. (9.1%).
At the same time, in the liabilities side of the balance sheet, the largest increase is observed in the lines:
-retained earnings (uncovered loss) - 6,932 thousand rubles. (70.1%);
-long-term borrowed funds - 2,000 thousand rubles. (20.2%);
-estimated liabilities - 645 thousand rubles. (6.5%).
Among the negatively changed balance sheet items, one can single out “accounts receivable” in assets and “short-term borrowings” in liabilities (-5,786 thousand rubles and -7,476 thousand rubles, respectively).
During the analyzed period, a very significant event took place - from 2,573.0 thousand rubles. up to RUB 9,505.0 thousand (3.7 times) - increase in own capital.
Table 2.2 Estimating the value of the organization's net assets
IndicatorValue of the indicatorChange in thousand rubles in % to the balance sheet thousandths. rub. (column 4-column 2)± % ((column 4-column 2) : gr.2) 12/31/201012/31/201112/31/2012 at the beginning of the analyzed period (12/31/2010) at the end of the analyzed period (12/31/2012) one. Net assets2 5736 1879 5058.729.7+6,932+3.7 times2. Authorized capital1501501500.50.5--3. Excess of net assets over authorized capital (line 1-line 2)2 4236 0379 3558.229.2+6,932+3.9 times
The net assets of the organization on the last day of the analyzed period (December 31, 2012) are much (63.4 times) higher than authorized capital. This positively characterizes the financial position, fully meeting the requirements of regulations for the value of the organization's net assets.
Rice. 2.3 Dynamics of net assets
Moreover, having determined the current state of the indicator, one should note an increase in net assets by 3.7 times during the analyzed period. The excess of net assets over the authorized capital and at the same time their increase over the period indicates a good financial position of the organization on this basis.
2.3 Analysis of the solvency and financial stability of the enterprise LLC "Trading House" Rusimport-Irkutsk "
The financial stability of Trading House Rusimport-Irkutsk LLC characterizes its financial position from the standpoint of the adequacy and efficiency of the use of equity capital. The indicators of financial stability together with the liquidity indicators characterize the reliability of Rusimport-Irkutsk Trading House LLC. The main indicators of the financial stability of the organization are presented in table 2.3.
Table 2.3 The main indicators of the financial stability of the organization
IndicatorIndicator valueIndicator change (column 4-column 2)Description of the indicator and its normative value31.12.201031.12.201131.12.20121. Autonomy coefficient 0.090.250.3+0.21 Ratio of equity to total capital. Normal value for this industry: 0.4 or more (optimum 0.5-0.7).2. Financial leverage ratio10.5132.36-8.15 Debt to equity ratio. Normal value for this industry: 1.5 or less (optimum 0.43-1).3. The coefficient of provision with own working capital-0.040.070.15+0.19 The ratio of own working capital to current assets. Normal value: 0.1 or more.4. Permanent asset index 1,410,780.6-0.81 The ratio of the value of non-current assets to the value of the organization's own capital.5. Investment coverage ratio0.090.330.36+0.27 The ratio of equity and long-term liabilities to total capital. Normal value: 0.7 or more.6. Equity capital flexibility ratio-0.410.220.4+0.81 Ratio of own working capital to sources of own funds. Normal value for this industry: 0.15 or more.7. Property mobility coefficient 0.880.80.82-0.06 The ratio of working capital to the value of all property. Characterizes the industry specifics of the organization.8. Mobility coefficient of working capital 0.010.010.19+0.18 The ratio of the most mobile part of working capital (cash and financial investments) to the total value of current assets.9. Inventory coverage ratio-0.170.190.52+0.69 The ratio of own working capital to the value of inventories. Normal value: 0.5 or more.10. Short-term debt ratio10.890.91-0.09Ratio of short-term debt to total debt.
The organization's autonomy coefficient as of December 31, 2012 was 0.3. The obtained value shows that due to the lack of equity capital (30% of total capital), the organization is largely dependent on creditors. During the analyzed period, a very strong, by 0.21, increase in the autonomy coefficient was noted.
The ratio of own working capital on the last day of the analyzed period was 0.15, but on December 31, 2010, the ratio of own working capital was much less - -0.04 (ie there was a change of +0.19). On the last day of the analyzed period, the coefficient is quite within the norm. Despite the fact that at the beginning of the period under review, the value of the ratio of own working capital did not correspond to the norm, later it took on a normal value.
The capital structure of the organization is clearly shown below in the diagram of Figure 2.4.
The investment coverage ratio for two years increased sharply by 0.27 and amounted to 0.36. The value of the coefficient on the last day of the analyzed period is significantly lower than the allowable value.
As of December 31, 2012, the inventories ratio was 0.52. For the entire period under review, there was a rapid, by 0.69, increase in the ratio of material reserves. Despite the fact that at the beginning of the analyzed period the value of the coefficient did not correspond to the norm, later it took on a normal value. As of December 31, 2012, the inventory ratio is quite within the norm.
The coefficient of short-term debt shows that the amount of short-term accounts payable of the organization significantly exceeds the amount of long-term debt (90.8% and 9.2%, respectively). At the same time, for the entire period under review, the share of long-term debt increased by 9.2%.
The dynamics of the main indicators of the financial stability of the organization is presented in the following graph of Figure 2.5.
Rice. 2.5 Dynamics of financial stability indicators
Table 2.4 Analysis of financial stability by the amount of surplus (shortage) of own working capital
Indicator of own working capital (SOS) The value of the indicator Surplus (shortage) * at the beginning of the analyzed period (12/31/2010) at the end of the analyzed period (12/31/2012) as of 12/31/2010 as of 12/31/2011 as of 12/31/2012 SOS1 (calculated without taking into account long-term and short-term liabilities) -1 0503 819-7 085-5 813-3 515СОК2 (calculated taking into account long-term liabilities; actually equals net working capital, Net Working Capital) and short-term debt on credits and loans)6 4265 880+391-3 797-1 454 * Surplus (deficiency) SOS is calculated as the difference between own working capital and the amount of stocks and costs.
Rice. 2.6 Own working capital
Since as of December 31, 2012 there is a shortage of own working capital calculated for all three options, the financial position of the organization on this basis can be characterized as unsatisfactory. It should be noted that, despite the unsatisfactory financial stability, two of the three indicators of the coverage of inventories by own working capital improved their values during the analyzed period.
Table 2.5 Liquidity ratios of Rusimport-Irkutsk Trading House LLC
Liquidity indicatorIndicator valueChange in the indicator (column 4 - gr.2) Calculation, recommended value31.12.201031.12.201131.12.20121. Current (total) liquidity ratio0.961.21.29+0.33Ratio of current assets to short-term liabilities. Normal value: 2 or more.2. Quick (intermediate) liquidity ratio 0.710.70.88+0.17Ratio of liquid assets to short-term liabilities. Normal value: 1 or more.3. Absolute liquidity ratio0.010.010.25+0.24Ratio of highly liquid assets to short-term liabilities. Normal value: not less than 0.2.
On the last day of the analyzed period, the current liquidity ratio is below the norm (1.29 against the standard value of 2). At the same time, it should be noted that there was a positive trend - for two recent years the coefficient increased by 0.33.
For the quick liquidity ratio, the normative value is 1. In this case, its value was 0.88. This means that Rusimport-Irkutsk Trading House LLC does not have enough assets that can be converted into cash in a short time to pay off short-term accounts payable. During the entire period, the quick liquidity ratio remained at a value that did not meet the standard. At a rate of 0.2, the value of the absolute liquidity ratio was 0.25. For the entire analyzed period, the coefficient increased by 0.24.
Rice. 2.7 Dynamics of liquidity ratios
Table 2.6 Analysis of the ratio of assets by liquidity and liabilities by maturity
Assets by degree of liquidity At the end of the reporting period, thousand rubles Growth for the analysis period, %Norm. Ratio Liabilities by maturity At the end of the reporting period, thousand rubles Growth for analysis. period, %surplus/ shortfall payment. Funds thousand rubles, (column 2 - gr.6) A1. Highly liquid assets (money + short-term financial investments)5,025+14 times?P1. The most urgent liabilities (borrowed funds) (current credit debt)17,078+1.4-12,053А2. Marketable assets (short-term debit debt)12,955-30.9?P2. Medium-term liabilities (short-term liabilities other than current credit debt)3 339-67.3+9 616А3. Slowly sold assets (other current assets)8 317+20.8?P3. Long-term liabilities2 061-+6 256А4. Hard-to-sell assets (non-current assets)5,686+56.9?P4. Permanent liabilities (equity)9,505+3.7 times-3,819
Of the four ratios that characterize the presence of liquid assets in an organization, all but one are met. Rusimport-Irkutsk Trading House LLC does not have enough cash and short-term financial investments (highly liquid assets) to pay off the most urgent liabilities (the difference is 12,053 thousand rubles). In accordance with the principles of the optimal structure of assets by the degree of liquidity, short-term receivables should be sufficient to cover medium-term liabilities (short-term debt minus current accounts payable). In this case, this ratio is fulfilled (quickly realizable assets exceed medium-term liabilities by 3.9 times).
2.4 Analysis of the financial performance of the organization
The financial results of the activities of Rusimport-Irkutsk Trading House LLC also characterize the indicators of revenue (gross income) from product sales, value added tax.
The proceeds from the sale of products characterizes the completion of the production cycle at the enterprise, the return of the enterprise's funds advanced for production into cash and the beginning of a new round in the circulation of funds.
The main financial results of Rusimport-Irkutsk Trading House LLC during the analyzed period are shown in Table 2.7 below.
Table 2.7 Main financial results of activity of Rusimport-Irkutsk Trading House LLC
IndicatorValue of the indicator, thousand rubles Change in the indicatorAverage annual value, thousand rubles 2011 2012 thousand rub. (group 3 - group 2) ± % ((3-2) : 2)1. Revenue116 894119 772+2 878+2.5118 3332. Expenses for ordinary activities111 518115 082+3 564+3.2113 3003. Profit (loss) from sales (1-2)5 3764 690-686-12.85 0334. Other income and expenses, except for interest payable34897-251-72,12235. EBIT (earnings before interest and taxes) (3+4)5 7244 787-937-16.45 2566. Interest payable603105-498-82.63547. Change in tax assets and liabilities, income tax and other -1,606-1,335+271?-1,4718 period3 5153 347-168-4.83 431Change for the period of retained earnings (uncovered loss) according to the balance sheet (changed on line 1370)3 6143 318xxx
In 2012, the value of revenue amounted to 119,772 thousand rubles, which is only 2,878 thousand rubles, or 2.5% more than in 2011.
Sales profit for 2012 amounted to 4,690 thousand rubles. For the entire analyzed period, the financial result from sales clearly decreased (-686 thousand rubles). Paying attention to line 2220 of form No. 2, it can be noted that the organization took into account general business (management) expenses as conditionally fixed, attributing them at the end of the reporting period to goods (works, services) sold. The change in revenue is clearly shown below in the graph of Figure 2.8.
Rice. 2.8 Dynamics of revenue and net profit
For the period 01.01-31.12.2012 the organization received a profit both from sales and in general from financial and economic activities, which led to the positive values of all three profitability indicators presented in the table.
Table 2.8 Profitability Analysis
Profitability indicatorsIndicator values (in %, or in kopecks from the ruble)Change in the indicator in 20112012 kop. Profitability of sales (the amount of profit from sales in each ruble of revenue). Normal value for this industry: 4% or more.4.63.9-0.7-14.92. EBIT return on sales (the amount of profit from sales before interest and taxes in each ruble of revenue) 4.94-0.9-18.43. Return on sales in terms of net profit (the amount of net profit in each ruble of revenue). 32.8-0.2-7.1 0.7-15.5 Interest payable coverage ratio (ICR), coefficient Normal value: 1.5 or more. 9.545.6 + 36.1 + 4.8 times
Profit from sales in the analyzed period is 3.9% of the proceeds received. However, there is a negative trend in the profitability of ordinary activities compared to this indicator for the period from 01/01/2011 to 12/31/2011 (-0.7%).
The profitability indicator, calculated as the ratio of profit before interest payable and taxation (EBIT) to the company's revenue, for the period from 01/01/2012 to 12/31/2012 amounted to 4%. That is, each ruble of the organization's revenue contained 4 kopecks. profit before tax and interest payable.
Rice. 2.9 Dynamics of profitability indicators
The return on the use of capital invested in entrepreneurial activity is presented in the following table 2.9.
Table 2.9 Indicators of profitability of the organization
Profitability indicatorIndicator value, %Change in the indicator (column 3 - gr.2)Calculation of the indicator20112012Return on equity (ROE)80.342.5-37.8Ratio of net profit to the average value of equity capital. Normal value for this industry: 18% or more. Return on assets (ROA) 12,911.8-1.1 The ratio of net profit to the average value of assets. Normal for this industry: 6% or more .1 The ratio of profit from sales to the average cost of fixed assets and inventories. For reference: Return on assets, coefficient 32.225.9-6.2 The ratio of revenue to the average cost of fixed assets.
Over the past year, each ruble of equity capital of Rusimport-Irkutsk Trading House LLC brought a net profit of 0.425 rubles. During the analyzed period, the decrease in the return on equity amounted to 37.8%. In 2012, the return on equity demonstrates quite a normal value. Return on assets for the last year amounted to 11.8%, which is 1.1% lower than the value of return on assets in 2011. The next graph in Figure 2.10 clearly shows the dynamics of the main indicators of the return on assets and capital of the organization for the entire analyzed period.
Rice. 2.10 Dynamics of the main indicators of return on assets and capital of the organization
Further in the table, the turnover indicators of a number of assets are calculated, characterizing the rate of return of funds advanced for implementation entrepreneurial activity cash, as well as the indicator of accounts payable turnover in settlements with suppliers and contractors.
Table 2.10 Asset turnover indicators
Turnover indicatorValue in daysFact. 2011 2012 Change, days (group 3 - group 2) 2011 2012 Working capital turnover (the ratio of the average value of current assets to the average daily revenue *; normal value for this industry: no more than 101 days) 72715.15.2-1 Inventory turnover (the ratio of the average Inventory value to average daily revenue; normal value for this industry: 46 days or less)212217.716.5+1 Accounts receivable turnover (ratio of average receivables to average daily revenue; normal value for this industry: 30 days or less)47377 ,79.8-10Turnover of accounts payable (the ratio of the average value of accounts payable to the average daily revenue)47467.87.9-1Turover of assets (the ratio of the average value of assets to the average daily revenue)85874.34.2+2Turnover of equity (the ratio of the average value of equity to average daily revenue)142426.715.2+10 * The indicator is calculated in days. The value of the coefficient is equal to the ratio of 365 to the value of the indicator in days.
Asset turnover on average for the entire period under review shows that the organization receives revenue equal to the sum of all available assets for 86 calendar days. At the same time, on average, it takes 21 days to receive revenue equal to the average annual balance of inventories.
Below, as one of the indicators reflecting the efficiency of the use of labor resources, labor productivity is presented (the ratio of sales proceeds to the average number of employees).
Rice. 2.11 Dynamics of labor productivity
In 2012, the value of labor productivity amounted to 4,607 thousand rubles/person, while in 2011 labor productivity was less - 4,329 thousand rubles/person. (i.e. growth amounted to 278 thousand rubles/person).
Table 2.11 below calculates the indicators contained in the methodology of the Federal Office for Insolvency (Bankruptcy) (Decree N 31-r dated 12.08.1994).
Table 2.11 Enterprise insolvency indicators
IndicatorIndicator value Change (column 3-column 2) Normative value Correspondence of the actual value with the normative one at the end of the period at the beginning of the period (31.12.2011) at the end of the period (31.12.2012)1. Current liquidity ratio1.51.54+0.04 no less than 2 does not correspond2. Equity ratio 0.070.15+0.08 not less than 0.1corresponds to 3. Solvency recovery ratiox0.78xnot less than 1does not correspond
Analysis of the balance sheet structure was performed for the period from the beginning of 2012 to December 31, 2012.
Since one of the first two ratios (the current liquidity ratio) as of December 31, 2012 turned out to be less than the normatively set value, the solvency recovery ratio was calculated as the third indicator. This coefficient serves to assess the prospects for the restoration of the normal structure of the balance sheet (solvency) by the enterprise within six months, while maintaining the trend of change in current liquidity and equity that took place in the analyzed period. The value of the coefficient of solvency restoration (0.78) indicates the absence of a real opportunity to restore normal solvency in the near future.
Below is an analysis of the creditworthiness of Rusimport-Irkutsk Trading House LLC according to the methodology of Sberbank of Russia (approved by the Sberbank of Russia Committee for the provision of loans and investments dated June 30, 2006 N 285-5-r).
Table 2.12 Analysis of the creditworthiness of Rusimport-Irkutsk Trading House LLC
Indicator Actual valueCategoryWeight of the indicatorCalculation of the sum of points For reference: indicator categories1 category2 category3 category Absolute liquidity ratio 0.0620.050.10.1 and above 0.05-0.1 less than 0.05 Intermediate (quick) liquidity ratio 1.0510.10.10.8 and above 0.5- 0.8 less than 0.5 Current liquidity ratio 1.5410.40.41.5 and above 1.0-1.5 less than 1.0 Equity ratio 0.410.20.20.25 and above 0.15-0.25 less than 0.15 Product profitability0 ,0420.150.30.1 and above less than 0.1 unprofitable.
In accordance with the methodology of Sberbank, borrowers are divided into three classes depending on the amount of points received:
-first-class - lending which is not in doubt (the sum of points up to 1.25);
-second class - lending requires a balanced approach (over 1.25 but less than 2.35);
-third class - lending is associated with increased risk (2.35 and above).
In this case, the score is 1.3. Therefore, the organization can count on obtaining a bank loan.
As one of the indicators of the probability of bankruptcy of an organization, Altman’s Z-score is calculated below (for Rusimport-Irkutsk Trading House LLC, a 4-factor model for private non-production companies was taken): Z-score = 6.56T1 + 3.26T2 + 6, 72T3+1.05T4
Table 2.13 Probability of bankruptcy of an organization
Coefficient Calculation Value as of December 31, 2012 Multiplier Product (column 3 x colum 4)T1Ratio of working capital to the value of all assets0,186,561.21T2Ratio of retained earnings to the value of all assets0,293,260.95T3Ratio of EBIT to the value of all assets0,156,721.01T4Ratio of equity to debt0 .421,050.44Z-Altman score: 3.61
The implied probability of bankruptcy, depending on the value of Altman's Z-score, is:
-1.1 and less - high probability of bankruptcy;
-from 1.1 to 2.6 - the average probability of bankruptcy;
-from 2.6 and above - low probability of bankruptcy.
For Rusimport-Irkutsk Trading House LLC, the Z-score value as of December 31, 2012 was 3.61. Such a value of the indicator indicates an insignificant probability of bankruptcy of Rusimport-Irkutsk Trading House LLC.
According to the results of the analysis, the financial position of Rusimport-Irkutsk Trading House LLC (Appendix B) was assessed on a point system at -0.17, which corresponds to the B rating (satisfactory position). The financial results of the organization for the last two years are estimated at +1.17, which corresponds to the rating A ( nice results). It should be noted that the final estimates were obtained taking into account both the values of the indicators at the end of the analyzed period and the dynamics of the indicators, including their predicted values for the next year. The final score of the financial condition, which combines the analysis of the financial position and the results of the organization's activities, is +0.37 - according to the rating scale, this is a normal state (BB).
The 'BB' rating reflects the financial condition of the organization, in which the bulk of the indicators fit into the normative values. Entities with this rating can be considered as partners with whom a prudent approach to risk management is required. An organization may qualify for loans, but the decision largely depends on the analysis of additional factors (neutral creditworthiness).
3. Measures to improve the financial condition of the enterprise LLC "Trading House" Rusimport-Irkutsk "
Measures to overcome the crisis and pre-crisis (such a situation has developed at Rusimport-Irkutsk Trading House LLC) situations at the enterprise can be operational and strategic, which, in turn, are divided into various methods that are proposed in Figure 3.1.
Rice. 3.1 Measures to overcome the crisis of a small business
The stabilization program should include a set of measures aimed at restoring the solvency of the enterprise. The terms of its implementation for an enterprise located in the zone of "near" bankruptcy are extremely limited, since, as a rule, it no longer has reserve funds.
When an enterprise enters a crisis state in the short term, the criterion becomes maximization, or saving money. At the same time, the maximization of funds can and should be carried out by measures that are not acceptable from the standpoint of conventional management. Anti-crisis management allows for any losses (including future losses), at the cost of which it is possible to restore the solvency of the enterprise today.
The essence of the stabilization program lies in the maneuvering of funds to fill the gap between their spending and receipt. The maneuver is carried out both by means already received and materialized in the assets of the enterprise, and by those that can be obtained if the enterprise survives the crisis. Filling the "crisis pit" can be carried out by increasing the flow of funds (maximization), and reducing the current need for working capital (savings). The increase in cash is based on the transfer of the company's assets into cash. The sale of receivables is obvious and is currently being undertaken by many businesses. Sale of stocks finished products more difficult - firstly, it involves selling at a loss, and secondly, it leads to complications with the tax authorities. However, as already noted, the essence of the stabilization program lies in the maneuvering of monetary resources. Losses in this case represent a donation of part of the money received in the past, and problems with paying taxes in such a sale are closed by a decrease in possible future receipts.
Reducing current financial needs. In practice, it is feasible only through some form of debt restructuring, which depends on the goodwill of the company's creditors. By itself, debt restructuring is not a specific tool of anti-crisis management, as it can be used even in a relatively prosperous state of the debtor enterprise. However, the crisis situation, on the one hand, somewhat facilitates the restructuring of debts, on the other hand, it justifies such forms of anti-crisis management, which are unsatisfactory in the normal state.
Buying back debt at a discount is one of the most desirable measures. The crisis state of the enterprise - the debtor devalues its debts, and therefore there is an opportunity to buy them at a significant discount. subtlety this decision within the framework of the stabilization program lies in the conditions under which a buyout can be carried out.
An analysis of the experience of Russian enterprises in difficult financial condition shows that most of them have a similar structure of current liabilities, in particular:
-liabilities for settlements with various debtors and creditors - 60.4%;
-liabilities for taxes and deductions - 11.6%.
The most important task of financial recovery is to minimize current costs, primarily utility bills. These measures are aimed at reducing liability flows and cash deficits.
Financial recovery measures aimed at restructuring the company's accounts payable, including overdue ones, may include the following procedures:
-deferrals and installment payments;
-offset of mutual payment claims (mutual offset);
-debt renewal in the form of a loan;
-sale of debt obligations;
-conversion of short-term liabilities into long-term ones.
Development of a strategy and program of action. The development of a strategy and an action program for its implementation means a transition from a reactive form of management (management decision-making as a reaction to current problems, to negative results obtained - “lag behind events”) to management based on analysis and forecast. The development of the strategy is carried out on the basis of forecasts for the development of markets for manufactured products, assessment of potential risks, analysis of the financial and economic condition and management efficiency, analysis of the strengths and weaknesses of the enterprise.
The company's strategy includes:
Market behavior strategy (selection of areas of influence, occupied market share, consumer groups, choice of activity strategy - competition, market expansion; pricing strategy - cost leadership, differentiation, niche, etc.).
In accordance with the strategy of market behavior, a system of actions (or policies) is determined:
-supply and marketing;
Price;
Financial;
-personnel and personnel management;
-a program of measures is being developed to ensure its implementation.
In accordance with the main directions of activity and the chosen strategy, it is determined how the organizational and managerial structure should be changed. When developing a strategy and action program, the goals and ways to achieve them are specified, a deeper analysis and a more thorough assessment of the effectiveness and degree of risk of activities are made.
Conclusion
Before this work, the goal was to analyze the financial stability of Rusimport-Irkutsk Trading House LLC, identify the main problems of creditworthiness, and also develop ways to improve the financial condition of the company. Based on the results of the analysis, the following conclusions were made:
On the negative side, the financial position and performance of the organization are characterized by the following indicators of Rusimport-Irkutsk Trading House LLC:
-low equity relative to total assets (30%);
-the current (total) liquidity ratio is below the normal value;
-below the normal value of the quick (intermediate) liquidity ratio;
-a significant drop in the profitability of sales (-0.7 percentage points from the profitability for 2011 equal to 4.6%);
-a significant drop in profit before interest payable and taxation (EBIT) per ruble of revenue of Rusimport-Irkutsk Trading House LLC (-0.9 kopecks from the same profitability indicator for 2011).
The analysis revealed the following positive indicators of the financial position and performance of the organization:
-the coefficient of provision with own working capital is quite within the norm (0.15);
-the absolute liquidity ratio corresponds to the normal value;
-for the period from 01/01/2012 to 12/31/2012, profit from sales was received (4,690 thousand rubles), although its negative dynamics was observed compared to the previous year (-686 thousand rubles);
-profit from financial and economic activities for the last year amounted to 3,347 thousand rubles.
From an exceptionally good side, the financial position and performance of the organization are characterized by the following indicators:
-net assets exceed the authorized capital, while during the analyzed period there was an increase in net assets;
-excellent return on assets (11.8% last year);
-a positive change in equity relative to the total change in the organization's assets.
Indicators of the financial position of the organization that are critical:
-the investment coverage ratio is significantly below the norm (the share of equity and long-term liabilities in the total capital of the organization is 36% (normal value: 70% or more);
-critical financial situation in terms of own working capital.
An indicator that is important at the boundary of the norm is the following - the normal ratio of assets in terms of liquidity and liabilities in terms of maturity is not fully observed.
According to the results of the analysis, the financial position of Rusimport-Irkutsk Trading House LLC was assessed by a point system at -0.17, which corresponds to a B rating (satisfactory position). The financial performance of the organization for the last two years is estimated at +1.17, which corresponds to the rating A (good results). It should be noted that the final estimates were obtained taking into account both the values of the indicators at the end of the analyzed period and the dynamics of the indicators, including their predicted values for the next year. The final score of the financial condition, which combines the analysis of the financial position and the results of the organization's activities, is +0.37 - according to the rating scale, this is a normal state (BB).
In the third part of the work, proposals are made to improve the efficiency of the activities of Rusimport-Irkutsk Trading House LLC, namely:
- Measures have been developed to increase the cash flow to Rusimport-Irkutsk Trading House LLC (short-term and long-term);
- Recommendations are given to reduce accounts payable;
- Proposals have been developed for a new policy for granting loans and managing receivables;
- Given in the calculation form ways to improve solvency indicators, which are at a level below the norm;
- The role of financial leverage for increasing the profitability of own funds is considered.
In general, based on the analysis, conclusions were drawn that testify to the problems associated primarily with the current operational management of finances at Rusimport-Irkutsk Trading House LLC. Financial management does not play a big role in the enterprise. In essence, financial management occurs at the level of the accounting service and the head of the enterprise. Therefore, it is necessary to organize a financial management service and take a number of measures to improve the financial condition in accordance with these recommendations.
solvency analysis company solvency
List of sources
1.Abryutina M.S., Grachev A.V. Analysis of the financial and economic activities of the enterprise [Text]: Educational and practical guide. M.: Business and Service, 2009. - 432 p.
.Analysis of the financial and economic activities of the enterprise [Text]: Proc. manual for universities / Ed. prof. N.P. Lyubushina - M.: UNITY-DANA, 2009. - 471s.
.Vinokurov M.A. Economics [Text] / M.A. Vinokurov, A.P. Sukhodolov. Irkutsk: IGEA (BGUEP), 2009. Vol. 1-3.
4.Galaziy G.I. Prices and production costs [Text] / G.I. Galazy. - M.: Knowledge, 2005. - 48 p.
.Galkina V.I. Problems of pricing and cost accounting [Text] / V.I. Galkin. - Irkutsk: Vost.-Sib. book. publishing house, 2009. - 45 p.
6.Garshina N.N. On the issue of staff wages [Text]: Tourist Firms / N.N. Garshina SPb., "Nevsky Fund", 2008. -224 p.
7.Goldstein G.Ya. Economics of the enterprise [Text]: textbook. allowance / Goldstein G.Ya. - Irkutsk: IGEA (BGUEP), 2009. -224 p.
8.Grushko Ya.M. New aspects of pricing [Text] / Ya.M. Grushko. - Irkutsk: Vost.-Sib. book. publishing house, 2007. - 252 p.
9.Gulyaev V.G. Labor organization and wages. [Text]: studies. allowance / V.G. Gulyaev - M.: KNOWLEDGE, 2011. - 200s.
10.Gurulev S.A. New aspects of pricing [Text] / S.A. Gurulev. - Irkutsk: IGEA (BSUEP), 2009. - 200p.
11.Dabaev V.Ts. Price calculation methods for new product(Guide) [Text] / V.Ts. Dabaev. St. Petersburg: "Norma", 2009. - 172 p.
12.Durovich A.P. Management at the enterprise [Text]: textbook. allowance / A.P. Durovich. - M.: BSEU, 2007 - 192p.
13.Durovich A.P. Enterprise development management [Text]: textbook. allowance / A.P. Durovich - 2nd ed., revised. and additional -Mn.: New edition, 2001. -
14.Efremova M.V. Fundamentals of business technology [Text]: Proc. allowance / M.V. Efremov. St. Petersburg: "Norma", 2009. - 172 p.
15.Ilyina E.N. Finance [Text]: textbook. allowance, Strategy and Finance / E.N. Ilyin. St. Petersburg: "Norma", 2009. - 172 p.
APPENDIX A
Financial results for the period 01.01.11-31.12.12 Financial position as of 31.12.2012 AAA AA A BBB BB B CCC CC C D Excellent (AAA) Very good (AA) Good (A) V Positive (BBB) Normal (BB) Satisfactory (B) Unsatisfactory (CCC) Bad (CC) Very bad (C) Critical (D) final rating of the financial condition of Rusimport-Irkutsk Trading House LLC: BB (normal)
IndicatorWeight of the indicatorScoreAverage score (group 3 x 0.25 + group 4 x 0.6 + group 5 x 0.15) The assessment taking into account the weight (group 2 x group 6) has passed to the present futureI. Indicators of the financial position of the organization Autonomy ratio 0.25-1-1+1-0.7-0.175 Ratio of net assets and authorized capital 0.1+2+2+2+2+0.2 Working capital ratio 0.15-1+1+ 2+0.65+0.098Current (total) liquidity ratio0.15-1-1-1-1-0.15Quick (intermediate) liquidity ratio0.2-1-1-1-1-0.2Absolute liquidity ratio0.15 -2+1+2+0.4+0.06Total1Final grade (total group 7: group 2): -0.167II. Performance indicators (financial results) of the organization's activities Return on equity 0.3+2+2-1+1.55+0.465 Return on assets 0.2+2+2+2+2+0.4 0.5-0.1Dynamics of revenue0.100000Turnover of working capital0.1+2+2+2+2+0.2Ratio of profit from other operations and proceeds from core activities0.1+2+2+2+2+0.2Total1Final assessment (total group 7: group 2): +1.165
Peculiarity express analysis of the financial and economic activities of the enterprise in that it is applied with limited primary information and within a narrow time frame. Despite the fact that any financial statements have certain limitations, the data contained in the form No. 1 (balance sheet) and form No. 2 (report on financial results) are most often available to the public.
In the express analysis of the financial and economic activities of the enterprise, the following stages can be distinguished:
Stage 1. Determining the purpose of the analysis. This stage is the most important, since the depth of calculations depends on the purpose of the express analysis.
Stage 2. visual analysis. At this stage, the problematic articles of the financial statements are identified, which should be given the closest attention in the future.
Stage 3. Calculation of indicators, which includes:
- horizontal analysis - comparison of each article with the previous period. It is carried out if necessary for some articles;
- vertical analysis or structure analysis. Vertical analysis - determination of the structure of financial indicators with the identification of the impact of each article on the result. Particular attention is paid to the problem articles identified at the 2nd stage;
- calculation of the required coefficients.
Consider conducting an express analysis of the financial and economic activities of an enterprise using the example of a conditional enterprise.
Determining the purpose of express analysis and visual analysis of financial statements
The purpose of express analysis is to determine how great are the risks of cooperation with this company when selling goods to it with deferred payment. To do this, first of all, we will build an analytical balance sheet based on the financial statements of a conditional company.
Table 1. Vertical and horizontal balance sheet analysis data
| 01.01.2013 | In % of the balance | 31.12.2013 | In % of the balance | Horizontal analysis |
||
|---|---|---|---|---|---|---|
| thousand roubles. | % | |||||
| ASSETS | ||||||
| Fixed assets | ||||||
| Intangible assets | 0,0% | 0,0% | 0 | |||
| Research and development results | 0,0% | 0,0% | 0 | |||
| fixed assets | 6 100 | 0,9% | 5 230 | 0,7% | -870 | 85,7% |
| Profitable investments in material values | 0,0% | 0,0% | 0 | |||
| Financial investments | 0,0% | 0,0% | 0 | |||
| Deferred tax assets | 0,0% | 0,0% | 0 | |||
| Other noncurrent assets | 87 | 0,0% | 87 | 0,0% | 0 | 100,0% |
| Total for Section I | 6 187 | 0,9% | 5 317 | 0,7% | -870 | 85,9% |
| current assets | ||||||
| Stocks | 374 445 | 54,3% | 392 120 | 53,9% | 17 675 | 104,7% |
| Value added tax on acquired valuables | 16 580 | 2,4% | 17 044 | 2,3% | 464 | 102,8% |
| Accounts receivable | 280 403 | 40,7% | 307 718 | 42,3% | 27 315 | 109,7% |
| Financial investments | 0,0% | 0,0% | 0 | |||
| Cash | 10 700 | 1,6% | 5 544 | 0,8% | -5 156 | 51,8% |
| Other current assets | 1 415 | 0,2% | 0,0% | -1 415 | 0,0% | |
| Total for Section II | 683 543 | 99,1% | 722 426 | 99,3% | 38 883 | 105,7% |
| BALANCE | 689 730 | 100,0% | 727 743 | 100,0% | 38 013 | 105,5% |
| LIABILITY | ||||||
| Capital and reserves | ||||||
| Authorized capital (share capital, authorized fund, contributions of comrades) | 10 | 0,0% | 10 | 0,0% | 0 | 100,0% |
| Own shares repurchased from shareholders | 0,0% | 0,0% | 0 | |||
| Revaluation of non-current assets | 0,0% | 0,0% | 0 | |||
| Additional capital (without revaluation) | 0,0% | 0,0% | 0 | |||
| Reserve capital | 0,0% | 0,0% | 0 | |||
| Retained earnings (uncovered loss) | 20 480 | 3,0% | 32 950 | 4,5% | 12 470 | 160,9% |
| Total for Section III | 20 490 | 3,0% | 32 960 | 4,5% | 12 470 | 160,9% |
| long term duties | ||||||
| Borrowed funds | 38 000 | 5,5% | 45 000 | 6,2% | 7 000 | 118,4% |
| Deferred tax liabilities | 0,0% | 0,0% | 0 | |||
| Provisions for contingent liabilities | 0,0% | 0,0% | 0 | |||
| Other liabilities | 0,0% | 0,0% | 0 | |||
| Total for Section IV | 38 000 | 5,5% | 45 000 | 6,2% | 7 000 | 118,4% |
| Short-term liabilities | ||||||
| Borrowed funds | 0,0% | 0,0% | 0 | |||
| Accounts payable, including: | 629 738 | 91,3% | 649 696 | 89,3% | 19 958 | 103,2% |
| suppliers and contractors | 626 400 | 90,8% | 642 532 | 88,3% | 16 132 | 102,6% |
| debt to the staff of the organization | 700 | 0,1% | 1 200 | 0,2% | 500 | 171,4% |
| debt on taxes and fees | 2 638 | 0,4% | 5 964 | 0,8% | 3 326 | 226,1% |
| Reserves for future expenses | 0,0% | 0,0% | 0 | |||
| Other liabilities | 1 502 | 0,2% | 87 | 0,0% | -1 415 | 5,8% |
| Section V total | 631 240 | 91,5% | 649 783 | 89,3% | 18 543 | 102,9% |
| BALANCE | 689 730 | 100,0% | 727 743 | 100,0% | 38 013 | 105,5% |
Table 2. Data from vertical and horizontal analysis of the income statement
| 2013 | In % of the balance | 2012 | In % of the balance | Horizontal analysis |
||
|---|---|---|---|---|---|---|
| thousand roubles. | % | |||||
| Revenue | 559876 | 100,0% | 554880 | 100,0% | 4 996 | 100,9% |
| Cost of sales | 449820 | 80,3% | 453049 | 81,6% | -3 229 | 99,3% |
| Gross profit (loss) | 110056 | 19,7% | 101831 | 18,4% | 8 225 | 108,1% |
| Selling expenses | 8 562 | 1,5% | 9 125 | 1,6% | -563 | 93,8% |
| Management expenses | 38 096 | 6,8% | 32 946 | 5,9% | 5 150 | 115,6% |
| Profit (loss) from sales | 63 398 | 11,3% | 59 760 | 10,8% | 3 638 | 106,1% |
| Interest receivable | 0,0% | 0,0% | 0 | |||
| Percentage to be paid | 4 950 | 0,9% | 4 180 | 0,8% | 770 | 118,4% |
| Other income | 0,0% | 0,0% | 0 | |||
| other expenses | 0,0% | 0,0% | 0 | |||
| Profit (loss) before tax | 58 448 | 10,4% | 55 580 | 10,0% | 2 868 | 105,2% |
| Net income (loss) | 46 758 | 8,4% | 44 464 | 8,0% | 2 294 | 105,2% |
| Section/article | conclusions | |
|---|---|---|
| Number increase | Decreasing the number | |
| During the year, the value of the item "Fixed assets" decreased slightly. This means that the company did not buy new fixed assets and did not sell old ones, and the decrease occurred as a result of depreciation on existing fixed assets. There were no changes in the item “Other non-current assets” in the company. | ||
| Current assets Inventories | A large number of inventories and their annual growth may indicate overstocking | A regular decrease in inventories can indicate both a decrease in business activity and a shortage of working capital. |
| In section II of the balance sheet, attention should be paid to such an article as VAT on acquired valuables. If the amount of tax is large and continues to increase, then it is likely that the company has some reason to reduce tax payments. These reasons may be: unsatisfactory organization of workflow, poor quality of tax accounting, purchases at inflated prices or from unreliable suppliers. The tax risks of such a company are high. | ||
| Accounts receivable. This balance sheet item is best considered in conjunction with the revenue indicator from Form No. 2 | If the growth of accounts receivable is associated with an increase in sales, then the growth in revenue is provided by an increase in the term for granting a commodity loan. If the increase occurs against the backdrop of a decrease in revenue, then, despite the change in the credit policy for the better for customers, the company failed to retain its customers. This indicates an increase in operational risks. | If a decrease in this item occurs against the background of an increase in revenue, it means that buyers began to pay their bills earlier, that is, there was a reduction in the days of delay or part of the goods is paid for in advance. If the revenue decreased, then the debt of buyers also decreased. |
| Accounts receivable may also include paid advances related to the construction or acquisition of fixed assets (PP). That is, such receivables in the future will turn either into fixed assets or construction in progress, and not into cash. | ||
| In section II, the largest amount is stocks. Their value has increased. It is necessary to carry out a vertical analysis and calculate the turnover ratio. The unclaimed VAT at the end of the year amounted to more than 17 million rubles, and this amount increased compared to the previous period. Conclusion: tax risks increase. Accounts receivable increased on the back of lower revenues. Further analysis needed | ||
| Capital and reserves | Authorized capital. As a rule, a change under this article occurs only if the company was re-registered, or a decision was made to increase the authorized capital | |
| Retained earnings (uncovered loss) | At this stage of the analysis, we look at the availability of the amount for this article. If a loss is reflected, then this article is classified as problematic. For a more detailed analysis of the data presented in the balance sheet, it is not enough | |
| The analyzed company's authorized capital has not changed. The amount of retained earnings has increased, which means that equity capital has also increased | ||
| Loans and credits | On the basis of the balance, one can observe the presence of short-term or long-term loans, the dynamics of their change. For any conclusions about the validity of attracting credit resources and their effectiveness at this stage, there is not enough information | |
| Long-term borrowed funds of the analyzed company increased | ||
| Accounts payable. Analyze by type of debt | An increase in debt to suppliers may indicate both a delay in payments and the presence of agreements to increase the delay as a result of maintaining the volume of purchases, payment on time, and the presence of good relationships. An increase in debt to the tax authorities may indicate an increase in the company's tax risk | A decrease in creditors may indicate both a more stringent credit policy of suppliers, and early fulfillment of payment obligations. A decrease in tax arrears shows both the timeliness of fulfilling tax obligations and lower taxes due to a decrease in business activity |
| Accounts payable of the analyzed company grew mainly due to the growth of debt to suppliers, as well as an increase in tax liabilities. This happened against the backdrop of an increase in inventories. This means that the purchased inventory was purchased with a deferred payment and the payment due date at the time of reporting did not come. For a more complete analysis, it is necessary to look at the change in the structure of obligations, i.e. calculate the share of the "creditors" and analyze the turnover. That is, for more reasonable conclusions on the financial condition of the company, a vertical analysis and analysis of the coefficients is necessary. Other liabilities of the enterprise in the analyzed period decreased. | ||
The balance sheet data also allows a preliminary assessment of the company's solvency at the reporting date. To do this, let's compare the cost of working capital with the value of short-term liabilities (722,426 - 649,783 = 72,643). The result obtained can be called the margin of safety of the company in terms of solvency.
When analyzing the income statement, it is better to resort to horizontal and vertical analysis.
It is necessary to pay attention to the following points: if revenue has increased, then an increase in the cost of goods sold (products) is normal. But if the increase in the cost of goods sold and administrative expenses occurred against the background of a decrease in revenue or its invariance, this should alert the analyst.
If this trend continues in the future, the company may experience problems with business efficiency and, as a result, with solvency. Estimated data, as well as forms of balance sheet and income statement are presented in tables 1 and 2.
Key indicators of the company
You can describe the change in numerical indicators both in structure and in growth rates for each article of the submitted forms. But this is not included in the tasks of express analysis, so let's pay attention to the most interesting trends.
So, we will make brief conclusions that are interesting from the point of view of express analysis. The revenue of the analyzed company in 2013 remained practically unchanged (0.9%) compared to the previous year. At the same time, net profit increased by 5.2%, which is a good indicator. As can be seen from the above calculations, the cost of goods sold decreased by 0.7%. The share of prime cost in the revenue structure also decreased from 81.6% in 2012 to up to 80.3% in the reporting period. This allowed the company to receive an additional 8,225 thousand rubles of gross profit in 2013.
It should be noted that the company's selling and administrative expenses increased by 10.9%. Their share in the revenue structure increased from 7.6% to 8.3%. If this trend continues in the future, the company is threatened with a decrease in efficiency.
Despite the fact that the company practically managed to maintain revenue at the level of 2012, accounts receivable increased by 9.7%. This may indicate that in order to maintain revenue, the company had to change its credit policy in the direction of increasing the number of days of delay in paying for goods sold.
Inventories increased by 4.7%, while the company's short-term liabilities increased by 2.9%. Based on this, we can conclude that the source of the increase in current assets were short-term liabilities.
Current (current) assets exceeded current (short-term) liabilities by 52,303 thousand rubles. in 2012 and 72643 thousand rubles. in 2013, which clearly indicates the solvency of the company.
Solvency assessment
As you can see, the composition of the company's property contains such articles as value added tax on acquired values.
Moreover, the balances of these items are increasing. Let's imagine a situation that in a certain period of time the company will need to urgently pay off all its obligations to creditors and it will be forced to sell its current assets.
The situation is similar with “incoming” VAT: what is the probability of presenting it for reimbursement from the budget if it has not been reimbursed to date? There can be two approaches here, let's call them conservative and loyal.
With a more loyal approach, the amount of "input" VAT can be taken into account in the calculations.
There is also a reasonable explanation for this approach: VAT refunds from the budget take quite a long time (only 90 days are given for a desk audit according to the Tax Code) and is associated with the emergence of additional tax risks and, which is not excluded, litigation. The change in the company's solvency, taking into account the above comments, is presented in table 3.
Table 3. Dynamics of the company's solvency
| Indicators | conservative approach | Loyal approach | ||
|---|---|---|---|---|
| 2012 | 2013 | 2012 | 2013 | |
| current assets | 683 543 | 722 426 | 683 543 | 722 426 |
| minus "incoming" VAT | 16 580 | 17 044 | ||
| Current assets (TA) | 666 963 | 705 382 | 683 543 | 722 426 |
| Current Liabilities (TO) | 631 240 | 649 783 | 631 240 | 649 783 |
| Difference between TA and TO | 35 723 | 55 599 | 52 303 | 72 643 |
As you can see, both in the first and in the second approach, the solvency of the company in 2013 improved significantly.
At present, the importance of analyzing the financial and economic activities of an enterprise is sharply increasing. The results of the analysis are of interest for various categories analysts: management personnel, representatives of financial authorities, tax inspectors, creditors, etc.
Under the financial condition refers to the ability of the company to finance its activities. It is characterized by the availability of financial resources necessary for the normal functioning of the enterprise, the expediency of their placement and efficiency of use, as well as financial relationships with other legal entities and individuals.
To begin with, we will conduct a horizontal and vertical analysis of the company's balance sheet for 3 years.
Horizontal analysis. In the process of analysis, first of all, one should study the dynamics of the organization's assets, changes in their composition and structure, and evaluate them. To do this, we will conduct a horizontal analysis of the assets of Gizartteks LLC.
Horizontal analysis allows you to compare each balance sheet position at the moment with the previous period. The analysis of the balance sheet asset contains information on the placement of capital at the disposal of the enterprise, i.e. on investing it in specific property and material values, on the costs of the enterprise for the production and sale of products, and on the balance of free cash.
The absolute change is calculated by calculating the difference between the corresponding indicators at the end and the beginning of the year, and the relative deviation is calculated by dividing the result of the absolute deviation by the value of the indicator at the beginning of the year. To conduct the analysis, we will use the financial statements of the enterprise, the profit and loss statement. All data will be presented in Table 3.
A horizontal analysis of the assets of Gizarttex LLC shows that their absolute amount for 2012 decreased by 33 million rubles, or by 13.4%. It can be concluded that the organization lowers its economic potential. The increase in current assets was due to an increase in the organization's cash by 212 million rubles and reserves.
Table 3. Analytical balance of assets (million rubles)
|
DEVIATION |
|||||||
|
Absolute |
Relative |
Absolute |
Relative |
||||
|
I. Current assets |
|||||||
|
Cash |
|||||||
|
Accounts receivable |
|||||||
|
Advances to suppliers |
|||||||
|
current assets total |
|||||||
|
II. Fixed assets |
|||||||
|
fixed assets |
|||||||
|
Including capital construction in progress |
|||||||
|
Intangible assets |
|||||||
|
Other noncurrent assets |
|||||||
|
Total non-current assets |
|||||||
|
total assets |
The growth of such an indicator as cash +212 mil. rubles indicates that the organization is not experiencing financial difficulties, because it has large financial resources that are not invested in excess stocks.
The increase in the accounts receivable figure is associated with an increase in sales, as there is an increase in the company's revenue. This indicator indicates an increase in the risk of non-payment or late payment for the products sold.
Analyzing the composition of non-current assets, it can be noted that the decrease in the indicator in 2012 compared to 2011 by - 33 million rubles was due to changes in the composition of fixed assets.
The second component of the analysis of the financial condition of the organization is the assessment of the sources of formation of the organization's funds.
To assess the sources, data from a horizontal analysis of balance sheet liabilities are used. Liability analysis allows you to determine what changes have occurred in the structure of equity and borrowed capital, how much long-term and short-term borrowed funds are involved in the turnover of the enterprise, i.e. the liability shows where the funds came from, to whom the enterprises owe them. Calculations of the absolute and relative changes in the indicators under consideration are similar to those of the asset.
Table 4. Liabilities of the analytical balance sheet (million rubles)
|
DEVIATION |
|||||||
|
Absolute |
Relative |
Absolute |
Relative |
||||
|
I. Short-term credits, loans |
|||||||
|
Accounts payable |
|||||||
|
Buyers advances |
|||||||
|
II. long term duties |
|||||||
|
Long-term credits, loans |
|||||||
|
III. Equity |
|||||||
|
Authorized capital |
|||||||
|
Extra capital |
|||||||
|
Accumulated profit |
|||||||
|
Own capital, total |
|||||||
|
Total Liabilities |
The increase in liabilities in 2012 of Gizarttex LLC occurred by 1,798 million rubles. The increase was mainly due to an increase in short-term liabilities by 52%. As of the end of the analyzed period (2012), liabilities consist entirely of accounts payable.
The increase in equity capital occurred by 1506 million rubles. The increase in equity capital at the end of the analyzed period (2012) occurred due to accumulated profit in the amount of 1395 million rubles. Despite a significant increase in equity capital, the additional and authorized capital of the organization remained unchanged.
Thus, based on the conducted horizontal analysis, we can say that the financial and economic activities of the enterprise contributed to the increase in its own capital.
Vertical analysis is carried out using an analytical table and involves the study of changes in the share of assets and liabilities of the balance sheet in order to predict changes in their structure.
Table 5. Vertical analysis of assets
|
Change in specific gravity |
||||||||
|
Cost, million rubles |
Cost, million rubles |
The share of the asset in the total value of the asset, % |
Cost, million rubles |
The share of the asset in the total value of the asset, % |
||||
|
current assets |
||||||||
|
Cash |
||||||||
|
Short-term financial investments |
||||||||
|
Accounts receivable |
||||||||
|
Advances to suppliers |
||||||||
|
Other current assets |
||||||||
|
current assets total |
||||||||
|
II. Fixed assets |
||||||||
|
Long-term financial investments |
||||||||
|
fixed assets |
||||||||
|
Incl. capital construction in progress |
||||||||
|
Intangible assets |
||||||||
|
Other noncurrent assets |
||||||||
|
Total non-current assets |
||||||||
|
total assets |
In the structure of the balance sheet assets of Gizarttex LLC, a significant share belongs to current assets. At the beginning of 2011, the value of current assets amounted to 78.2% of their total value, and at the end of the year - 92.7%. There is a tendency to increase the share of this type of assets.
As of January 1, 2011, commodity stocks had a significant share in current assets - 73%. During the period under review, there is a tendency to increase them in the current assets of GizarTeks LLC.
The next type of current assets with a significant share was accounts receivable. As of January 1, 2011, the share of this type of assets was 1.5%, by the end of 2012 the share increased by 5.2%.
The share of non-current assets at the beginning of 2011 was 21.8%, increased compared to 2010 by 0.9%. However, at the beginning of 2012, the share is 7.3%. There is a downward trend in this type of assets. The decrease is caused by the reduction of fixed assets - the elimination of obsolete equipment.
Liabilities include equity and short-term liabilities. Therefore, according to the share of liabilities, we can conclude that the sources of financial and economic activity of the enterprise have changed.
Table 6. Vertical analysis of liabilities
|
Change in specific gravity |
||||||||
|
Cost, million rubles |
The share of the asset in the total value of the asset, % |
Cost, million rubles |
The share of the asset in the total value of the asset,% |
Cost, million rubles |
The share of the asset in the total value of the asset, % |
|||
|
Short-term credits, loans |
||||||||
|
Accounts payable |
||||||||
|
Buyers advances |
||||||||
|
Other current liabilities |
||||||||
|
Current liabilities, total |
||||||||
|
II.Long-term liabilities |
||||||||
|
Long-term credits, loans |
||||||||
|
Other long-term liabilities |
||||||||
|
Total long-term liabilities |
||||||||
|
III. Equity |
||||||||
|
Authorized capital |
||||||||
|
Extra capital |
||||||||
|
Accumulated profit |
||||||||
|
Other sources of equity |
||||||||
|
Own capital, total |
||||||||
|
Total Liabilities |
During the analyzed period in 2011 there is a decrease in the share of equity by 0.66% compared to 2010 and is 50.66%. It should be noted that keeping the share of equity below 50% is undesirable, as the company will depend on loans. However, in 2012, the share of equity increased significantly to 70.98% due to accumulated profits and other sources of equity.
The company had no long-term liabilities for the analyzed period. If we take into account the possibility of replacing short-term liabilities with long-term ones, then the predominance of short-term sources in the structure of borrowed funds is a negative factor that characterizes the deterioration of the balance sheet structure and the increased risk of loss of financial stability.
The share of short-term liabilities in 2012 decreased compared to 2010-2011 by 22.83%.
For an organization, it is important not only to perform an analysis and competently present the results, but also to formulate recommendations based on them to improve indicators and quality characteristics in the organization's activities. The main purpose of financial analysis is not the calculation of indicators, but the ability to interpret the results.
Based on the horizontal and vertical analysis of the balance sheet, positive and negative trends in changes in sections and balance sheet items are determined.
In the structure of the assets of the organization LLC "Gizartteks" a large share belongs to the money. During the period under review, the share of current assets was more than 50%. This indicates the formation of a mobile structure of assets, which contributes to the acceleration of the turnover of the organization's working capital.
A complete picture of the state of solvency of the enterprise can be presented by analyzing the liquidity ratios.
In the practice of analytical work, a system of liquidity indicators is used, calculated according to the following formulas.
The absolute liquidity ratio is determined by the following formula:
Cal=Ds/Kfo (5)
where: Cal - absolute liquidity ratio; Ds - cash; CFO - short-term financial obligations.
The quick liquidity ratio is determined by the following formula:
Kbl=Ds+Kfv+Kdz/Kfo (6)
where: Кbl - quick liquidity ratio; Ds - cash; Kdz - short-term receivables; Kfv - short-term financial investments; CFO - short-term financial obligations.
Satisfactory is usually considered the value of this indicator 0.7-1.
The current liquidity ratio (general coverage ratio) shows the extent to which current assets cover short-term liabilities. A coefficient with a value greater than 2.0 is considered satisfactory.
Ktl=Ta/Ko (7)
where: Ktl - current liquidity ratio; Ta - current assets; Ko - short-term liabilities.
These indicators allow you to determine the ability of the company to pay its short-term obligations during the reporting period.
Calculate the liquidity ratios. By al 2010 -55/498=0.11
By tl 2010 -903/498=1.81.
By bl 2010 -55+0+25/498=0.16.
K al 2011 -43/558=0.08.
By tl 2011 -885/558=1.58.
By bl 2011 -43+0+17/558=0.11.
K al 2012 -255/750=0.34.
By tl 2012 -2716/750=3.62.
By bl 2012 -255+0+197/750=0.6.
The data will be presented in Table 7.
Table 7. Dynamics of liquidity indicators (million rubles)
The current liquidity ratio characterizes the general security of the enterprise with working capital for conducting economic activities and timely repayment of urgent obligations of the enterprise. The current liquidity ratio shows that in 2011 1 ruble of current liabilities accounted for 1.58 rubles of current assets, while in 2010 this figure was 1.81, and already in 2012 this ratio was 3.62 rubles . current assets per 1 ruble of current liabilities. This indicates an increase in the payment capabilities of the enterprise.
The quick liquidity ratio is similar in meaning to the previous indicator, however, it is calculated for a narrower range of current assets, when the most liquid part of them - inventories and material costs - is excluded from the calculation. Quick (term) liquidity ratio characterizes the company's ability to repay current (short-term) liabilities at the expense of current assets. Ratio increase in 2011-2012 from 0.11 to 0.6 is mainly due to a decrease in accounts payable of the enterprise.
If the current ratio is in the acceptable range, while the quick ratio is unacceptably low, then this means that the company can restore its technical solvency by selling its warehouse stock and receivables, however, as a result, it may lose the opportunity to normally function.
The absolute liquidity ratio of the 2011 indicator - 0.08 rose to 0.34 in 2012. Thus, the company can pay off its obligations as a matter of urgency.
The company Gizartteks LLC is liquid, that is, it has the ability to turn its assets into cash and pay off its payment obligations on time. However, he should pay attention to the quick liquidity ratio, which is unacceptably low.
Table 8
In 2012, there is a positive trend in the development of the enterprise: the growth rate of revenue was 274.5%, which indicates an increase in sales of products; the balance sheet profit growth rate is 427.9%; net profit 461.5%, profit from the sale of products 361%. And this is despite the fact that in 2011 the profit from the sale of products decreased significantly compared to 2010 by 221 million rubles. The increase in net profit is a positive trend, indicating the business activity of the enterprise.
We study the system of performance indicators of the enterprise. The most interesting indicators are return on assets, return on equity, return on sales.
Return on assets is an indicator of the profitability and efficiency of the company, cleared of the influence of the amount of borrowed funds. It is used to compare enterprises in the same industry and is calculated by the formula:
Profitability = Net profit / average value assets (8)
The return on assets shows how much profit there is for each ruble invested in the property of the organization.
- 1. Awareness of taking risks. Since financial risk is an objective phenomenon, it is impossible to completely exclude risk from the financial activity of an enterprise. After assessing the level of risk for individual transactions, you can adopt the tactics of "risk avoidance". Awareness of risk acceptance is an indispensable condition for neutralizing the consequences of risk.
- 2. Manageability of accepted risks. The portfolio of financial risks should include mainly those that can be neutralized.
- 3. Independence of individual risk management. Financial losses for various types risks are independent of each other and in the process of managing them must be neutralized individually.
- 4. Comparability of the level of accepted risks with the level of profitability of financial transactions. The enterprise should accept in the process of financial activities only those types of financial risks, the level of which does not exceed the corresponding level of profitability on the "profitability - risk" scale.
Any type of risk for which the level of risk is higher than the level of expected return (with the risk premium included in it) should be rejected by the enterprise (or the size of the premium for and risk should be revised accordingly).
- 5. Comparability of the level of accepted risks with the financial capabilities of the enterprise. Expected Size financial loss enterprise, corresponding to a particular level of financial risk, must correspond to the share of capital that provides internal risk insurance.
- 6. Effectiveness of risk management. The cost of the enterprise to neutralize the financial risk should not exceed the amount of possible financial losses on it, even with the highest degree of probability of a risk event. The criterion for the effectiveness of risk management must be observed in the implementation of both self-insurance and external insurance of financial risks
- 7. Accounting for the period of the operation in risk management. The longer the period of a financial transaction, the wider the range of associated risks. If it is necessary to carry out such financial transactions, the enterprise must ensure that it receives the necessary additional level of profitability not only due to the risk premium, but also the liquidity premium, since the period of the financial transaction is a period of "frozen liquidity" of the capital invested in it. Only in this case, the enterprise will have the necessary financial potential to neutralize the negative financial consequences of such an operation in the event of a possible risk event.
- 8. Accounting for the financial strategy of the enterprise in the process of risk management. The financial risk management system should be based on the general criteria of the financial strategy chosen by the enterprise (reflecting its financial ideology in relation to the level of acceptable risks), as well as financial policy in certain areas of financial activity.
- 9. Accounting for the possibility of risk transfer. Risk avoidance involves avoiding risk, refusing to implement an event (project) associated with risk. Such a decision is made in case of non-compliance with the above principles. However, it should be borne in mind that the avoidance of one type of risk may lead to the emergence of others.
Page 1
The financial and economic activity of the enterprise is characterized primarily by the number and range of products, as well as the volume of its implementation. The value of the volume of output depends on the presence of many conditions and prerequisites, namely, production capacities, the availability of raw materials, materials, components, personnel of appropriate qualifications, product sales markets.
The financial and economic activity of the enterprise is characterized primarily by the number and range of products, as well as the volume of its implementation. The value of the volume of output depends on the presence of many conditions and prerequisites, namely, production capacities, the availability of raw materials, materials, components, personnel of appropriate qualifications, product sales markets. In turn, the volume of manufactured products affects all other aspects of the financial and economic activities of the enterprise - the cost of products, the amount of profit received, the profitability of production, the financial condition of the enterprise.
The financial and economic activity of enterprises is a purposeful activity based on decisions made, each of which is optimized based on intuition or calculations. Decision risk is understood as the probability of discrepancy between the actually obtained results of the implemented decision and the set goals.
The financial and economic activity of an enterprise depends on many factors (resources, conditions, etc.), and the impact and comparative characteristics of not all of them lend themselves to a formalized assessment. From the standpoint of the possibility of such an assessment, it is customary to allocate labor, material and financial resources of the enterprise.
The financial and economic activity of enterprises is accompanied by the implementation of numerous and varied operations. In turn, each business transaction must be formalized with accounting documents that contain primary information about the business transactions performed or the right to perform them. The objects of accounting documents are the processes of supply, production and sale, as well as individual divisions of the enterprise and various financial, economic, settlement relations within and outside the enterprise.
The financial and economic activities of enterprises (associations) are evaluated on the basis of complex analysis, objectively revealing shortcomings, omissions, losses, bottlenecks, and at the same time identifying those labor collectives that work honestly, conscientiously, constantly increase cash savings.
An analysis of the financial and economic activities of an enterprise can be more or less detailed, in-depth, or, conversely, an express analysis. Any one direction of activity can be analyzed (for example, analysis of the location and functioning of the distribution network or analysis of monetary and other settlements of the enterprise) - in this case, the analysis will be thematic. If the sphere of interests of the analytical group includes the entire enterprise as a complex, then such an analysis should be called complex.
An analysis of the financial and economic activities of an enterprise is very often in its form an analysis of indicators, i.e. characteristics of the economic activity of the economic unit. The term scorecard is widely used in economic research. The analyst, in accordance with certain criteria, selects indicators, forms a system from them, and analyzes it. The complexity of the analysis requires the use of entire systems, rather than individual indicators.
An analysis of the financial and economic activities of an enterprise will not be complete if it does not concern two more specific aspects of its activities. It is, first of all, about what place in the complex assessment of the enterprise is the quality of its products. If the products are of low quality, cause complaints from consumers, do not meet sanitary standards, state or market standards, the activity of the enterprise cannot be called successful, its comprehensive assessment will be low. The prospects for such an enterprise, if it does not intend to radically change its market strategy and product quality, cannot be considered brilliant.
Analysis of the financial and economic activities of an enterprise subject to state support, should contain the following information for the reporting period.
We also recommend
 Forget about the signs of the Zodiac: the horoscope for decades is three times more accurate Aries 2 decades teenager description
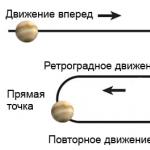 Venus Retrograde What is Venus Retrograde
 Everything you wanted to know about Venus retrograde: what will it bring and how to survive?
 Signs of Early Multiple Pregnancy When Can You See a Multiple Pregnancy?
 Happy birthday to my beloved teacher from a student
 True horoscope for Sagittarius