Results of lottery draw 6 out of 45. Secrets of forecasting in Gosloto: choosing numbers. How to select winning combinations
When tossing a coin, the probability of getting “heads” or “tails” is 50/50. Of course, it does not follow from this that after “heads” a “tails” will necessarily fall out. However, it is absolutely certain that the more attempts are made, the closer the average value will be to 50%. If, for example, a coin is tossed one hundred thousand times, then the occurrence of “heads” and “tails” will be distributed approximately equally.
The same applies to lotteries. Chances of guessing one or the other prize category are known, it is quite possible to see how much they coincide with the mathematically expected ones.
Let's take lottery 6 out of 45 from Gosloto
The probability of winning by category is as follows:
2 numbers - 1:7
3rd - 1:45
4 numbers - 1:733
5th - 1:34 808
6 numbers - 1:8 145 060
More than 1,800 draws have already taken place in lottery 6 out of 45; the base is quite sufficient for a correct comparison. So, from the 1st to the 1826th draw, players bet 479 million combinations
68.4 million "twos" (479,000,000 / 7)
10.6 million "threes" (479,000,000 / 45)
653 thousand “fours” (479,000,000 / 733)
13,761 “fives” (479,000,000 / 34,808)
And finally - 58 “sixes” (479,000,000 / 8,145,060)
Did this really happen?
Let's compare; during the same period, that is, from the 1st to the 1826th circulation, the following fell:
77.7 million “twos” - 113%
11.5 million “threes” - 108%
701 thousand “fours” - 107%
15,177 “fives” - 110%
But! That's not the fun part!
The most interesting thing is that the prize of the main category in numerical lotteries from Gosloto was not always so unattainable. For example, in the first few years, six was rolled out regularly, within the statistically expected range.
Just a few years ago, six was more common:
During 2008-2011, players placed 6 out of 45 bets on the lottery - 115.5 million bets. “Six” was guessed 12 times during the same period, that is, 9,625,000 combinations were obtained on average for each win. Or 118% of the statistically expected (8,145,060) result
What happened after 2011?
For 2012 - 2016 (1827 editions inclusive), players placed 364 million bets. According to the laws of statistics, 44 “sixes” should have fallen during this time. And during the same period, they turned out only 17 times. Almost three times (!!) less than it should be
Such a serious deviation, and only in one category, means only one thing - the organizers are dishonest and manipulate the winning combination in their favor. Simply put, jackpots are artificially grown and taken to the side
Number of bets (in millions) required to guess a six

(the last jack has not yet been guessed. There are already 40 million bets...)
As you can see in this diagram, for some time now there have been no-jack series, when instead of an average of 8.1 million bets, guessing the “six” requires 30-40 million bets. Which is several times (!!) higher than the calculated value. I'll tell you this - incredibly, damn much.
If we return to the comparison of tossing a coin, then perhaps 80 thousand “heads” when tossing 100 thousand times will, I think, be a phenomenon of the same order. Since this simply cannot be, there are only two explanations here: either, something is wrong with the coin. Or, the thrower can control its flight and land it accordingly, on the desired side...
So in numerical lotteries from Gosloto, the organizers violate the laws of statistics, since they simply control the occurrence of a “winning” combination. The discrepancy only and exclusively in the prizes of the main category clearly shows this. It remains to add that all this began in 2011, after the cancellation live broadcast. And it finally took hold in December 2013, after the transition to RNG
Exactly the same fantastic discrepancies with statistics occur in the 6 out of 36 lottery
The odds of winning by category are as follows:
2 numbers - 1:8
3 numbers - 1:81
4 numbers - 1:432
5 numbers - 1:376,992
More than 4,000 draws have already taken place in lottery 5 out of 36, so it’s even more interesting to look at the results
From the 1st to the 4184th draw, players placed 313 million bets
It can be expected that during this time the following was guessed:
39.1 million "twos" (313,000,000 / 8)
3.8 million "threes" (313,000,000 / 81)
128 thousand “fours” (479,000,000 / 2,432)
And finally - 830 “fives” (479,000,000 / 376,992)
What do we really have?
37.2 million “twos” - 95%
3.8 million “threes” - 100%
125.8 thousand “fours” - 98%
And - what do you think, how many “fives” did you get - 100%, 90%, or maybe 95%?
Ah, here comes the fig, dear friends!
A total of 421 fives were guessed throughout the entire period.
That is, again - two times less than calculated...
once upon a time "fives were guessed much more often than now

By the way. If you look at the number of bets on one “five” for another period, for example from the same 2012, you can see that:
- the number of bets during this period amounted to 246 million
- with such a volume of bets there should be 652 “fives”
In reality, during this time there were only 198 fives. Again - three times less than it should be.
P.s. The 6 out of 45 lottery is now luring players with another record jackpot - 242 million rubles. I can only say one thing to everyone who wants to try their luck - this money is not prepared for you guys! The organizers are most likely simply pocketing the record super prizes. What’s the point of participating in a lottery where it’s already clear who will take it? main prize?
P.p.s. Anyone who wants can compare the results themselves; I am posting the file with the data in the public domain.
And get rich - use one of the mathematical systems developed on the basis of combinatorics. Their use allows you to accurately determine the number of tickets that will need to be filled in order to make a profit, since they allow you to predict the result of crossing out a particular set of numbers.
Systems can be complete or incomplete. The first is the totality of all possible combinations of a certain number of numbers. As already mentioned when playing the “6 out of 45” lottery, there are 8,145,060 such combinations. Thus, playing with full systems makes sense only if you guess the numbers in a small range.
An incomplete system is only part of the totality of all possible combinations, in other words, it allows you to guess only part of the 6 required numbers, but in this case winning tickets(unless, of course, you have one) there will be more. When using an incomplete system, your chances will increase in proportion to the number of crossed out numbers.
Many systems are based on dividing all declared numbers into groups. For example, all 45 numbers can be divided into 3 groups, 15 numbers in each. And then the game can be built on the principle of crossing out only one of the groups, or several numbers in each group, or most of the cells in one of the groups with several numbers from other groups.
There are also several ways to select numbers for the game. You can create a table where you can record the results of all past draws. This will help you track the frequency of numbers that appear. Do not rush to cross out all combinations at once. Perhaps some of them will seem unlikely to you, then you should either completely discard them or try to replace some numbers in them. Keep an eye on the appearance of adjacent numbers: practice has shown that in half of the draws the winning six contains at least one pair of adjacent numbers.
Please note
A combination can be considered obviously unlikely if you are going to cross out the combination of numbers that came out in the previous draw; sequence of 4 – 6 digits in a row; as well as combinations made from all even or odd numbers.
Decide on the amount you are willing to lose, since no one is insured against losing, and even the use of the most sophisticated mathematical systems does not guarantee you victory.
Sources:
- lottery system
- Gosloto table 927 lottery draw 6 out of 45
Tip 2: Where to find the results latest draws Gosloto
Having appeared in November 2008, the Gosloto game very quickly took a leading position in the Russian lottery market. Its draws take place three times a week, each of them involves up to half a million bets, the proceeds are directed to the development of domestic sports.
Check Gosloto tickets on the official lottery website by marking the numbers on the electronic coupon or manually entering the data from your ticket. In the same section of the site you can view the archive of previous editions. In addition, here you can get information on issues related to purchasing tickets and claiming winnings.
There are separate Internet resources “Gosloto” “6 out of 45” and “5 out of 36”. Select the one you need, depending on what game you played, and open the main page of the site. At the top of the window, in the center, the results of the current current draw will be indicated. You can also find out the results of various draws by clicking on the link located in the lower right corner of the page. Among other things, on the official Gosloto website you can familiarize yourself with the rules and options of the game, the most frequently asked questions from people regarding this lottery, and read general information.
If you need to know the results of any Gosloto lottery draw, you can watch the entry last draw by going to the website stoloto.ru. Television broadcasts of the game are not currently being carried out, but the video can be viewed on-line on the above resource by clicking on the link “Watch the Gosloto show”, as well as in a recording, for example, on the Outube service.
Buy the newspaper "Sport-Express" (issues for
A little about lotteries
In numerical lotteries, a single simple combination is equally probable and is “a single indivisible entity.” In other words, in the space of a complete array, all elements (mentally imagine “cubes”) have the same size, therefore, there are no priority individual combinations. It is impossible to single out “universal combinations” in the entire array that will “always” play better than others, since the lottery machine or circulation generator is equally likely! What is most striking is that even many experienced players do not understand this.
Equal distribution
played combinations –
simple proof #1
Let's move on to the most natural statistics in numerical lotteries - combinatorial. To do this, you need to translate all the winning combinations, for example, in the lottery 5 out of 36, into their serial number (index) in the full array. A scatter plot of the distribution of these combinations in the space of the full array can then be plotted, while respecting the interval and location in the circulation history. Each point on this graph represents a combination that actually played in the space of the full array. Since each individual combination is distributed equally likely throughout the entire array, we can divide this space into equal parts (sectors).
Let's divide the full array of 376992 combinations,
let's say - into 12 equal parts - sectors
- 31416 combinations.
All combinations that actually played on at the moment in lottery 5 out of 36
(equiprobable distribution), selected sector - any

Let's count the number of matches of each sector over the last 500 draws.
On average, there will be approximately the same number of hits of a combination in any sector - 41 times.
The chance of any sector to match is 376,992/31416 = 1 time in 12 draws (average)
For 500 draws, any sector will play 500/ 12 = 41 times (average) or 4 times for 50 draws or 2 times for 25
If the combination plays in the selected sector, then the chance of the jackpot increases 12 times for one simple combination from this sector, and will be equal to 1 in 31416. If we have 10 combinations in the game, then 1 in 3141.
What is a single combination?
Let's see what a single combination is using the example of lottery 5 out of 36. There are 376,992 such combinations in this lottery. Each combination has its own serial number in the full array (index - cell).
First combination (000001) = 01-02-03-04-05 ...
Last combination (376992) = 32-33-34-35-36 = 376992 pieces
000001 _ 01-02-03-04-05
000002 _ 01-02-03-04-06
000003 _ 01-02-03-04-07
000004 _ 01-02-03-04-08
…….
…….
…….
002024 _ 01-02-07-11-30
002025 _ 01-02-07-11-31
002026 _ 01-02-07-11-32
…….
…….
174078 _ 04-21-25-32-34
174079 _ 04-21-25-32-35
…….
376992 _ 32-33-34-35-36
Absolutely any combination in the full array is no different from others in terms of the probability of a match.
To better understand this, you need to imagine 376,992 individual lottery balls, with all 376,992 combinations labeled.
It is difficult to imagine such a quantity, much less fit it into a picture; I will show only a few balls out of 376,992 pieces.
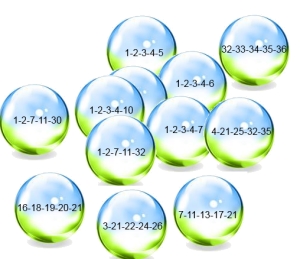
Let's do a thought experiment- let's place these balls in a huge lottery machine, which throws out only one ball with the combination indicated on this ball for each draw. We should not forget that after each draw, the dropped ball with the combination indicated on it is thrown back into the same lottery drum. Thus, on next edition all combinations will be in place again, and when the lottery machine starts, they will be mixed along with everyone else.
If it is difficult to imagine the option with balls, then let’s try to imagine a huge roulette wheel, where each ball cell represents a combination. There are 376,992 such cells, since such a lined wheel also cannot fit into the picture, so for a general understanding we will draw only a tiny part with combinations - we have highlighted the initial and final ones.

Take a closer look at the picture- the “wheel” is divided into equal cells (equally probable combinations), and the ball (draw generator) can fall into any hole (cell - index), no matter how we designated these cells (even with pictures). After the draw (spin), the wheel does not decrease - all cells remain in place.
- Note: I would like to draw your attention once again - I am writing about a whole simple single combination. For each individual combination (cell), the meaning of any even, odd, sums, intervals between numbers, repetitions, consecutive numbers, etc. is completely lost - since the combination is a single whole and denotes a cell (index) in the full array, and their huge quantity.
We can trace only individual areas of the array (sectors, ranges, groups of numbers) for the upcoming games, therefore, we will increase our chances of winning the main prize (in individual draws) tens and even hundreds of times. Depends on which sector (array, range) we guess.
Equal distribution
combinations played - simple proof No. 2
Let's take an example of 24 numbers (lottery 6 out of 45), chosen at random.
Let's calculate the probability of complete and partial coincidence on real story circulations simplified (simple calculation, and quite accurate for a large number of circulations), then we use special function HYPERGEOMET, which is present in Excel spreadsheets. This is a statistical function that can be used to calculate the probability of a complete or partial match.
(click to enlarge)

2311 lottery draws 6-45 have been loaded.
1. One match showed in 128 draws
2311/128 = 1 to 18.1.
HYPERGEOMET = 1 to 16.6.
2. Two matches showed in 472 circulations
2311/472 = 1 to 4.9
HYPERGEOMET = 1 to 4.9
3. Three matches were shown in 754 circulations.
2311/754 = 1 to 3.1
HYPERGEOMET =1 to 3.02
4. Four matches were shown in 659 circulations.
2311/659 = 1 to 3.5
HYPERGEOMET = 1 to 3.6
5. Five matches were shown in 249 circulations.
2311/249 = 1 to 9.3
HYPERGEOMET = 1 to 9.12
6. Six matches were shown in 37 runs.
2311/37 = 1 to 62.5
HYPERGEOMET = 1 to 60.51
As you can see, the probability of complete and partial coincidence almost completely coincides with the calculated values. This means that the lottery generator produces combinations with equal probability. When generating or manually marking any markers, the values will differ slightly, but they will be close to the theoretical ones. The more circulation history is loaded, the closer the result. Due to the fact that the circulation in the archive is catastrophically small, we use groups of numbers of sufficient length.
From the uniform (equiprobable) distribution, another conclusion follows: it doesn’t matter which numbers are included in the group of numbers - even, odd, the top of the playing field or the bottom, etc. The only thing that matters is the number of numbers in the group, on which the probability directly depends. We look at the screenshot - 18 numbers of markers are marked - random, top, even.
(click to enlarge)
There are no significant differences in the intensity of the coincidence of 5 numbers.
In other words, the circulation generator pays attention to any marked markers evenly, no matter what you “draw” on the playing field. Sometimes they “advise” to play with so-called “pieces” - this will not change anything in terms of the probability of a match - any “piece” will play with the same frequency as a “non-piece”...
Now we know for sure - any marked group of numbers, in equal numbers, has the same probability of coincidence. Why? Because it is made up of equally probable simple combinations. In this case, how can we even understand which group may be more likely to play in the coming games?
Strategic combination generators for numerical lotteries

When you realize that a particular combination is equally likely,
then some people are completely confused about common statistics :)
For example, why “even-odd” is played in the “majority” in a certain proportion, or why “sum” plays in the middle range and more. It turns out that the combinations seem to be not equally probable? This question is easy to answer, precisely after fully realizing that a single combination is equally probable. So why do combinations seem to “love to play” in certain proportions, ranges, amounts - if they are equally probable?
- Because we “select” arrays of equally probable single combinations with this information. It is important to know here how many combinations obtained in dedicated sectors. Arrays of combinations, highlighted with statistical information - contain different quantities equally probable combinations, therefore, these arrays have different probability for a coincidence.
Let's look at the example of statistics
even, odd numbers
- Let's try to understand one of popular tips when choosing a combination:
choose combinations that contain an equal number of even and odd numbers
Let's figure out why this happens. In lottery 5 out of 36, the most common odds and evens will look like this: 2 even – 3 odd, or 3 even – 2 odd. We count the number (even - odd) of all possible combinations in the lottery 5 out of 36

To better understand why a lottery machine or circulation generator random numbers tries to throw out such combinations of numbers in combinations, let us turn for clarity to the roulette wheel, which is nothing more than an equally probable random number generator, unless, of course, it is skewed
Let's distribute all combinations according to odd-even criteria together, and according to the table,
Let's draw a circular graph - imagine that these are marked sectors on a roulette wheel

Mentally add the largest sectors that contain 124848 combinations together = 124848 pieces (2 even - 3 odd) + 124848 pieces (3 odd - 2 even) = 249696 combinations out of 376992 possible, or 66.23%, or the chance of these two sectors is 376992/ 249696 = 1 to 1.5 for each spin (draw) or approximately 33 numbers out of 36.
That is why, with each test (roulette spin) of a lottery machine or draw generator, combinations from this sector will tend, in most cases, to play in an odds ratio of 2-3 or 3-2.
- In this example it plays not a separate combination– here a dedicated “huge sector” with combinations plays, in other words, we have marked approximately 33 numbers out of 36, naturally, almost always this number of numbers will “catch” all the prize money!
Why parity in combinations like 2-3 or 3-2? Everything is explained by the costs of the decimal system, which encodes the whole combination. Each individual whole (complete) combination simply represents a cell of 376,992 pieces. Recall the thought experiment with balls, in which the combination is indicated as a whole, or an example with a roulette wheel, where each combination simply designates a cell and is indivisible. But how we select the array of combinations does not matter. It’s just convenient to follow these signs (even-odd) for part of the array - the sector.
If we generate any random combinations for the same number of combinations (2469696 pieces), regardless of these proportions in general, then nothing will change in terms of the probability of matching the resulting array (sector) (1 to 1.5). Any equally probable random combination generator will seem to follow this advice on its own (without any filters) - What’s interesting is that no one specifically programs it this way, putting instructions (algorithm) into it to produce exactly these combinations of numbers.
Don't believe me? Check it out for yourself!
1. Review the draw history - most odd-even combinations will be 2-3, 3-2 (5 out of 36) and 3-3 (6 out of 45).
2. Take any random number generator, combinations - generate and write down the resulting combinations, then check.
Conclusion:
- Most likely, such advice is addressed to those who manually fill out tickets, without any software, even a simple random combination generator will follow this advice on its own.
- This advice is of little use to us, since the sector contains two-thirds of all combinations - not in roulette, because we play for dozens, where the chance is 1 in 3.
- This advice is suitable for lotteries that take place very rarely, although it will not help much.
- It is more correct to try to guess sectors 1-4, 4-1, and with fairly frequent circulations 5-0, 0-5 (we are waiting for the average period)
The “6 out of 45” lottery is held daily, twice a day at 11:00 and 23:00 Moscow time. This lottery has become most famous big win in the history of Russia (though until recently, this record was broken in the 1204th drawing of the “Russian Lotto”).
Gosloto 6 out of 45 lottery tickets can be purchased at retail point sales, and on the website stoloto.ru (the second option is more convenient, because you can buy a ticket in a couple of minutes and check it immediately after the drawing).
Rules for the “6 out of 45” lottery draw
The drawing involves 45 numbers ranging from 1 to 45, and to win you need to guess 2 to 6 numbers on one ticket.
When purchasing and filling out tickets, there is a feature called an expanded bet. With it, you can mark not 6 numbers, but up to 13 numbers when purchasing tickets online and up to 19 numbers when purchasing at points of distribution of paper tickets. At the same time, the possibility of winning increases significantly, but the cost of the ticket also increases.
Rules for filling out “6 out of 45” lottery tickets
If the ticket was purchased at a retail outlet.
These tickets have 6 playing fields (A, B, C, D, D, E) and each of them has 45 numbers (from 1 to 45).
- Select at least 6 numbers in any field - you can fill in one field or six at once (A, B, C, D, E, E).
- By marking “Automatic” on the ticket, you choose to autofill the ticket: the system itself will select a random combination of numbers for you.
- To take part in several draws, indicate their number in a special column.
- Enter your phone number to back side ticket and pay for it.
- Don't throw away your receipt!
If the ticket was purchased on the website stoloto.ru:
Just mark from 6 to 13 numbers and pay for the ticket.
Table:
- 6 numbers - 1 possible combination - price 100 rubles;
- 7 numbers - 7 possible combinations - price 700 rubles;
- 8 numbers - 28 possible combinations - price 2,800 rubles;
- 9 numbers - 84 possible combinations - price 8,400 rubles;
- 10 numbers - 210 possible combinations - price 21,000 rubles;
- 11 numbers - 462 possible combinations - price 46,200 rubles;
- 12 numbers - 924 possible combinations - price 92,400 rubles;
- 13 numbers - 1,716 possible combinations - price 171,600 rubles;
- 14 numbers - 3,003 possible combinations - price 300,300 rubles;
- 15 numbers - 5,005 possible combinations - price 500,500 rubles;
- 16 numbers - 8,008 possible combinations - price 800,800 rubles;
- 17 numbers - 12,376 possible combinations - price 1,237,600 rubles;
- 18 numbers - 18,564 possible combinations - price 1,856,400 rubles;
- 19 numbers - 27,132 possible combinations - price 2,713,200 rubles.
In addition, you can select the number of draws in which your ticket will participate (maximum 9).
How to win the Jackpot, win Gosloto 6 out of 45
In order to win the Super Prize (Jackpot) of the lottery, you need to guess all 6 numbers out of the 45 drawn on the ticket. Participants who guessed 2 numbers receive 100 rubles and then in ascending order with each subsequent number guessed.
The minimum guaranteed Super Prize is 10,000,000 rubles, but almost always it is several times or even tens more.
You can find out how to receive your winnings by calling +7 499 27-027-27 or *777 (free for Beeline, Megafon, MTS and Tele2 subscribers).
The biggest Super Prize was won in the 2943rd draw on May 21, 2017. Its amount is 364,685,787 rubles.
Search by: years :
When you click on this selection, a list of drawing years appears. We click on the year we are interested in and in the results table below we will see all the circulations held for this year:
Search by: dates :
When you click on this selection, two windows will appear to indicate the range of draw dates.
In the first window - “From:” we enter or insert the date from which you would like to view the circulations, in the second - “To:” we enter or insert the date up to which inclusive the circulations will be shown in the results table below.
In the first window we indicate an earlier date, and in the second - a later date for the State Loto Stoloto draws.
Search by: circulations:
When you click on this selection, two windows will appear to indicate the circulation interval.
In the first window - "From:" we enter the circulation from which you would like to see the results, in the second - "To:" we enter the circulation up to and including the search results will be shown in the circulation table below.
In the first window we indicate the earlier draw, and in the second - the later draw of the state lotto game Stoloto.
If the windows remain empty, then the entire archive of circulations for the entire duration of the game is displayed.
To distribute the combination numbers not in the order of numbers drawn during the draw, but in ascending order, you need to check the box next to the phrase - Numbers - ascending.
To highlight the numbers that you want to see and track their movement from circulation to circulation, write or paste them into the boxes next to the phrase - Highlight numbers.
If you want to insert the combination numbers of the last drawn draw into the highlight windows, then click on the button - Last Draw,
You can also generate and insert a combination by clicking on the button - Generate.
Description of additional columns in the circulation archive table.
Column Even shows the number of even numbers drawn in a certain combination.
Column Odd shows the number, respectively, of odd numbers drawn in a certain combination.
In column Sum of numbers
The sum of all numbers of a certain combination is calculated and displayed.
For example, archive 5 out of 36, circulation No. 7240, numbers: 34, 09, 12, 21, 30. Add them up and get the sum of the numbers 34+9+12+21+30 = 106.
And finally the last columns 1-10, 11-20, 21-30, 31-36 for archive 5 of 36,
1-10, 11-20, 21-30, 31-40, 41-45 for archive 6 of 45,
1-10, 11-20, 21-30, 31-40, 41-49 for archive 7 of 49
show how many numbers are included in a certain ten numbers.
Let's consider this using the example of numbers of the same circulation No. 7240, combination: 34 09 12 21 30.
Column 1-10 contains 1 number - 9,
Column 11-20 also contains 1 number - 12,
Column 21-30 already contains 2 numbers - 21 and 30
Column 31-36 contains 1 number - 34.
We also recommend
 Temple of the Tikhvin Icon of the Mother of God on Ave.
 The miraculous icon of St. Nicholas of Zaraisk St. Nicholas of Zaraisk with life
 How to smoke cheek meat at home
 Receiving a property deduction through an employer
 Interpretation of sleep to treat in dream books
 Buckwheat in a frying pan with onions and carrots Cook buckwheat with carrots and onions